Category Archives: The Skinny

April Sellers Bring Full Price Offers

By Aubray Erhardt on Tuesday, May 17th, 2016

New Listings showed a second year-over-year decline in 2016 while pending purchase activity rose for the 17th straight month. Buyers signed 6,373 new purchase agreements, a small but important 1.6 percent gain compared to a record-setting April 2015. Due to the well-known supply shortages in our market, would-be sellers are concerned about their ability to secure their next property in the current environment. Inventory levels fell 19.4 percent to 12,849 active properties. Because of record demand, weak supply and a more expensive mix of homes selling, the April median sales price rose 7.7 percent to $231,500. Median list price, by contrast, has already reached and exceeded its previous record, perhaps an indication that the median sales price could do the same this year.

As was the case in March, serious buyers came out swinging in April. In fact, sellers had the same chance of getting offers above their current list price as they did below. Those odds were exactly fifty-fifty—as they were in 2005. That’s not the case for original list price, which indicates that once a home is properly priced, serious buyers are willing to write full-price offers. Unsurprisingly, homes tended to sell in less time, with cumulative days on market declining 14.1 percent to 73 days. That’s the lowest April figure since 2007. Months supply of inventory fell 27.8 percent to 2.6 months—the lowest April figure on record going back to 2003. Generally, five to six months of supply is considered a balanced market. While our region as a whole is favoring sellers, not all areas, segments or price points necessarily reflect that.

“This is an important milestone that speaks to the health of our market,” said Judy Shields, Minneapolis Area Association of REALTORS® (MAAR) President. “Sellers should not interpret this to mean they are guaranteed offers above their list price. Every price range, area and segment is still unique. It’s more important now than ever to properly price your home. This means buyers–particularly those in multiple offers–should be ready to make full price offers on the properties that best fits their needs.”

The last time absorption rates, consumer demand and home prices were where they are today, the median percent of current list price received at sale was also 100.0 percent, so this isn’t entirely unfamiliar territory. There was also significantly more inventory in 2004 and 2005. The marketplace is finally closing the gap from the recession before advancing—sustained by smarter lending policy, job and wage increases, population growth, the risk of higher interest rates and relentlessly rising rents. It’s worth noting that traditional sales tend to fetch a higher ratio of sales price to list price. For the first April since 2007, traditional sales made up over 90.0 percent of overall sales, which boosts the percentage of current list price received.

The national unemployment rate for April was unchanged at 5.0 percent. With a local unemployment rate of 4.0 percent, the Minneapolis-St.Paul-Bloomington metropolitan area was among the top ten large metros with the lowest unemployment rate. The 30-year fixed mortgage rate continued to hover just above 3.6 percent compared to a long-term average of about 8.0 percent. Rates took a surprising dive after the Federal Reserve announced the first hike last year. Marginally higher rates were widely expected in 2016, even though a June rate hike seems unlikely.

“The economy is still strengthening and the market is very competitive,” said Cotty Lowry, MAAR President-Elect. “Serious buyers must be prepared to make strong offers right away or risk not having their offer accepted.”
From The Skinny Blog.

It’s Going DOM For Real

By David Arbit on Wednesday, April 27th, 2016
KCM-DOM-702x527
We don’t often talk about the national housing market, because, well, that isn’t really a thing. You read that right. There is no national housing market! The same way there is no national weather forecast. You don’t grab an umbrella in Miami based on the weather in Seattle, do you? So why would you base a decision to buy or sell real property in Minneapolis on data from Phoenix, Cleveland, Las Vegas and St. Louis? You wouldn’t. Because that would be silly.

So from the standpoint of a family or individual in the midst of a local decision-making process, national data is more or less worthless. Worse, it can actually lead to negative outcomes if a local decision was made based on national figures. Perhaps a Case-Shiller report showed that home prices are rising across their 20-city composite index. But that doesn’t mean prices are rising in every neighborhood or city, or even a particular section of a neighborhood. However, when it comes to bench-marking how we’re doing in Minnesota against other states, national-scale market data can play a marginally useful role.

The folks at Keeping Current Matters (KCM) have taken information from NAR’s Monthly REALTOR® Confidence Survey to generate a heat map showing hot spots and cold spots around the country. The darkest blue represents states where homes sell quickly (30 days and under). The darkest orange represents states where homes tend to sell in over 90 days.

As you can see (and as most agents know), Minnesota homes tend to sell quickly. Our state is in the top quintile, among a group of only five other states. It’s a safe bet that our acute inventory shortage plays a large role in this dynamic, but our extremely competitive labor market, attractive business climate, affordable housing stock, high quality of life, diversity, top-notch schools and our treasured parks and water bodies also play a big role in attracting and keeping people here. That translates into strong demand for housing, which—when combined with very low supply levels—means homes tend to sell pretty quickly.

From The Skinny Blog.

Twin Cities Housing Market Has Most Closed Sales Since 2005

By Aubray Erhardt on Wednesday, January 20th, 2016

At a press conference today, REALTOR® associations reported that the Twin Cities Metropolitan Area had the best year in terms of the number of closed sales since 2005. Closed sales finished 2015 13.7% better than 2014, boasting 56,390 compared to 49,604 in 2014.

The median sales price in 2015 was $220,000, a 7.0% increase from $205,600 in 2014. This is on top of gains in recent years of +14.4% in 2013 and 11.9% in 2012. The median sales price of single family homes was up 5.6% and townhouse-condos were up 3.8% over the prior year, continuing multi-year positive trends. Distressed sales were a mere 10.6% of all closed sales in 2015. This represents a one-year change in sales of foreclosures and short sales of -26.7%.

“Last year (2015) really showcased the durability of our economic and housing recovery, despite a few obstacles. As sales hit a 10-year high, the Twin Citizens are just as committed to homeownership as ever. Attractive rates, rising rents, job growth, wage increases and the lowest unemployment rate of any major metro area will continue to be positive factors for real estate,” said Judy Shields, President of the Minneapolis Area Association of REALTORS®

Months’ supply of inventory ended the year at an unprecedented low of 2.1 months. This metric indicates how long it would take to sell-off all existing inventory if no new inventory was added and is generally considered balanced, favoring neither buyer nor seller, at 5.0 months. While this metric indicates a sellers’ market that may leave some buyers with fewer options, it also has some market watchers asking themselves whether we’ve seen the supply bottom. While inventory is certainly a metric to watch it’s probably best measured and compared throughout the selling season and not at year end.

“Since inventory conditions vary across the metro and market conditions change quickly, would-be sellers are encouraged to contact their REALTORS® for an updated market analysis. Your home might be worth more than you think,” said Bob Clark, President of the Saint Paul Area Association of REALTORS®.

Days on market continued to shrink, ending 2015 at just 76 days on the market – a 10-year record low.

Percent of original list price, a metric that demonstrates a relationship of the original list price compared to the final sales price remains strong at 96.6% overall and across market segments. For example, this means if a home was originally listed at $100,000 its final sales price was $96,600.

Single family homes and townhouse-condo segments were at 96.6% of original list. Previously owned was at 96.4%. New construction topped out a 99.6% of original list. This indicates sellers have regained their pricing power and are accepting near-full price offers on their listings.

“We know that well maintained, appropriately priced homes with amenities are selling fairly quickly but moreover the data shows that as well,” said Clark.
From The Skinny Blog.

Asking All the Rate Questions

By David Arbit on Monday, December 14th, 2015

By David Arbit, Director of Research & Economics

Abstract: There is no question we are in a rising interest rate environment. The Fed may begin to normalize rates starting in December 2015. Inflation has been low, jobs numbers have been strong, wage growth is accelerating, unemployment has fallen dramatically and the U.S. is one of the few bright spots in today’s global economy. The process of rate normalization will be slow and incremental—the Fed is well aware that raising rates too quickly could threaten the recovery. It’s important to remember that there are many factors affecting consumer-facing rates other than Fed policy. Moreover, rising wages and an improving labor market could offset some of the declining affordability brought on by marginally higher rates and rising home prices. Keeping rates this low for too long poses its own set of risks. It’s tempting to be blinded by the recent past, but many consumers were lining up to get mortgages at 17.0% or higher only a few decades ago. Ultimately, higher interest rates are unlikely to derail the recovery and could even deliver some positive outcomes.

Precisely six years and six months after the official end of the Great Recession, the Federal Reserve (Fed) finally seems poised to normalize what have been the lowest interest rates in 50 years. Rates have remained low in an effort to help spur borrowing and growth for businesses and consumers, and they’ve mostly accomplished that goal without the rampant inflation feared by some hawks. That said, leaving rates this low for too long poses its own set of risks. There is a somewhat delicate balancing act.

What exactly does the Fed do? By law, the Fed has a dual mandate: maximum employment and price stability in the form of mild inflation. Excluding a bit of volatility here and there (mostly food and energy), there has been a good deal of progress on both fronts. As the Fed signals that they’re confident enough in the economy’s ability to withstand higher rates, most consumers should feel good about that assessment. Consumers—particularly prospective home buyers—should also understand that mortgage rates are expected to remain below average for years to come. In other words, some will undoubtedly rush to close on a property so they can brag about a sub-4.0% interest rate at backyard barbecues but the reality is that mortgage rates will remain attractive for some time.

FedFundsRate-and-MortgageRate2-702x490

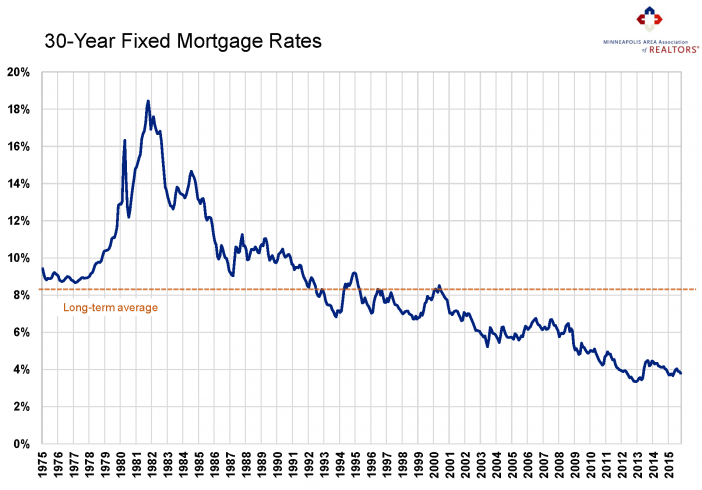
Just what has been the trend with mortgage rates? As the trendline above indicates, mortgage rates have been declining for the last 35 years. They hit a high of 18.5% in 1981 and a 50-year low of 3.3% in 2012, compared to a long-term average of about 8.0%. Many consumers benefited from 30-year mortgage rates below 4.0% between 2012 and 2015. This spurred a lot of refinancing activity in addition to first-time and move-up home buyer purchase activity.

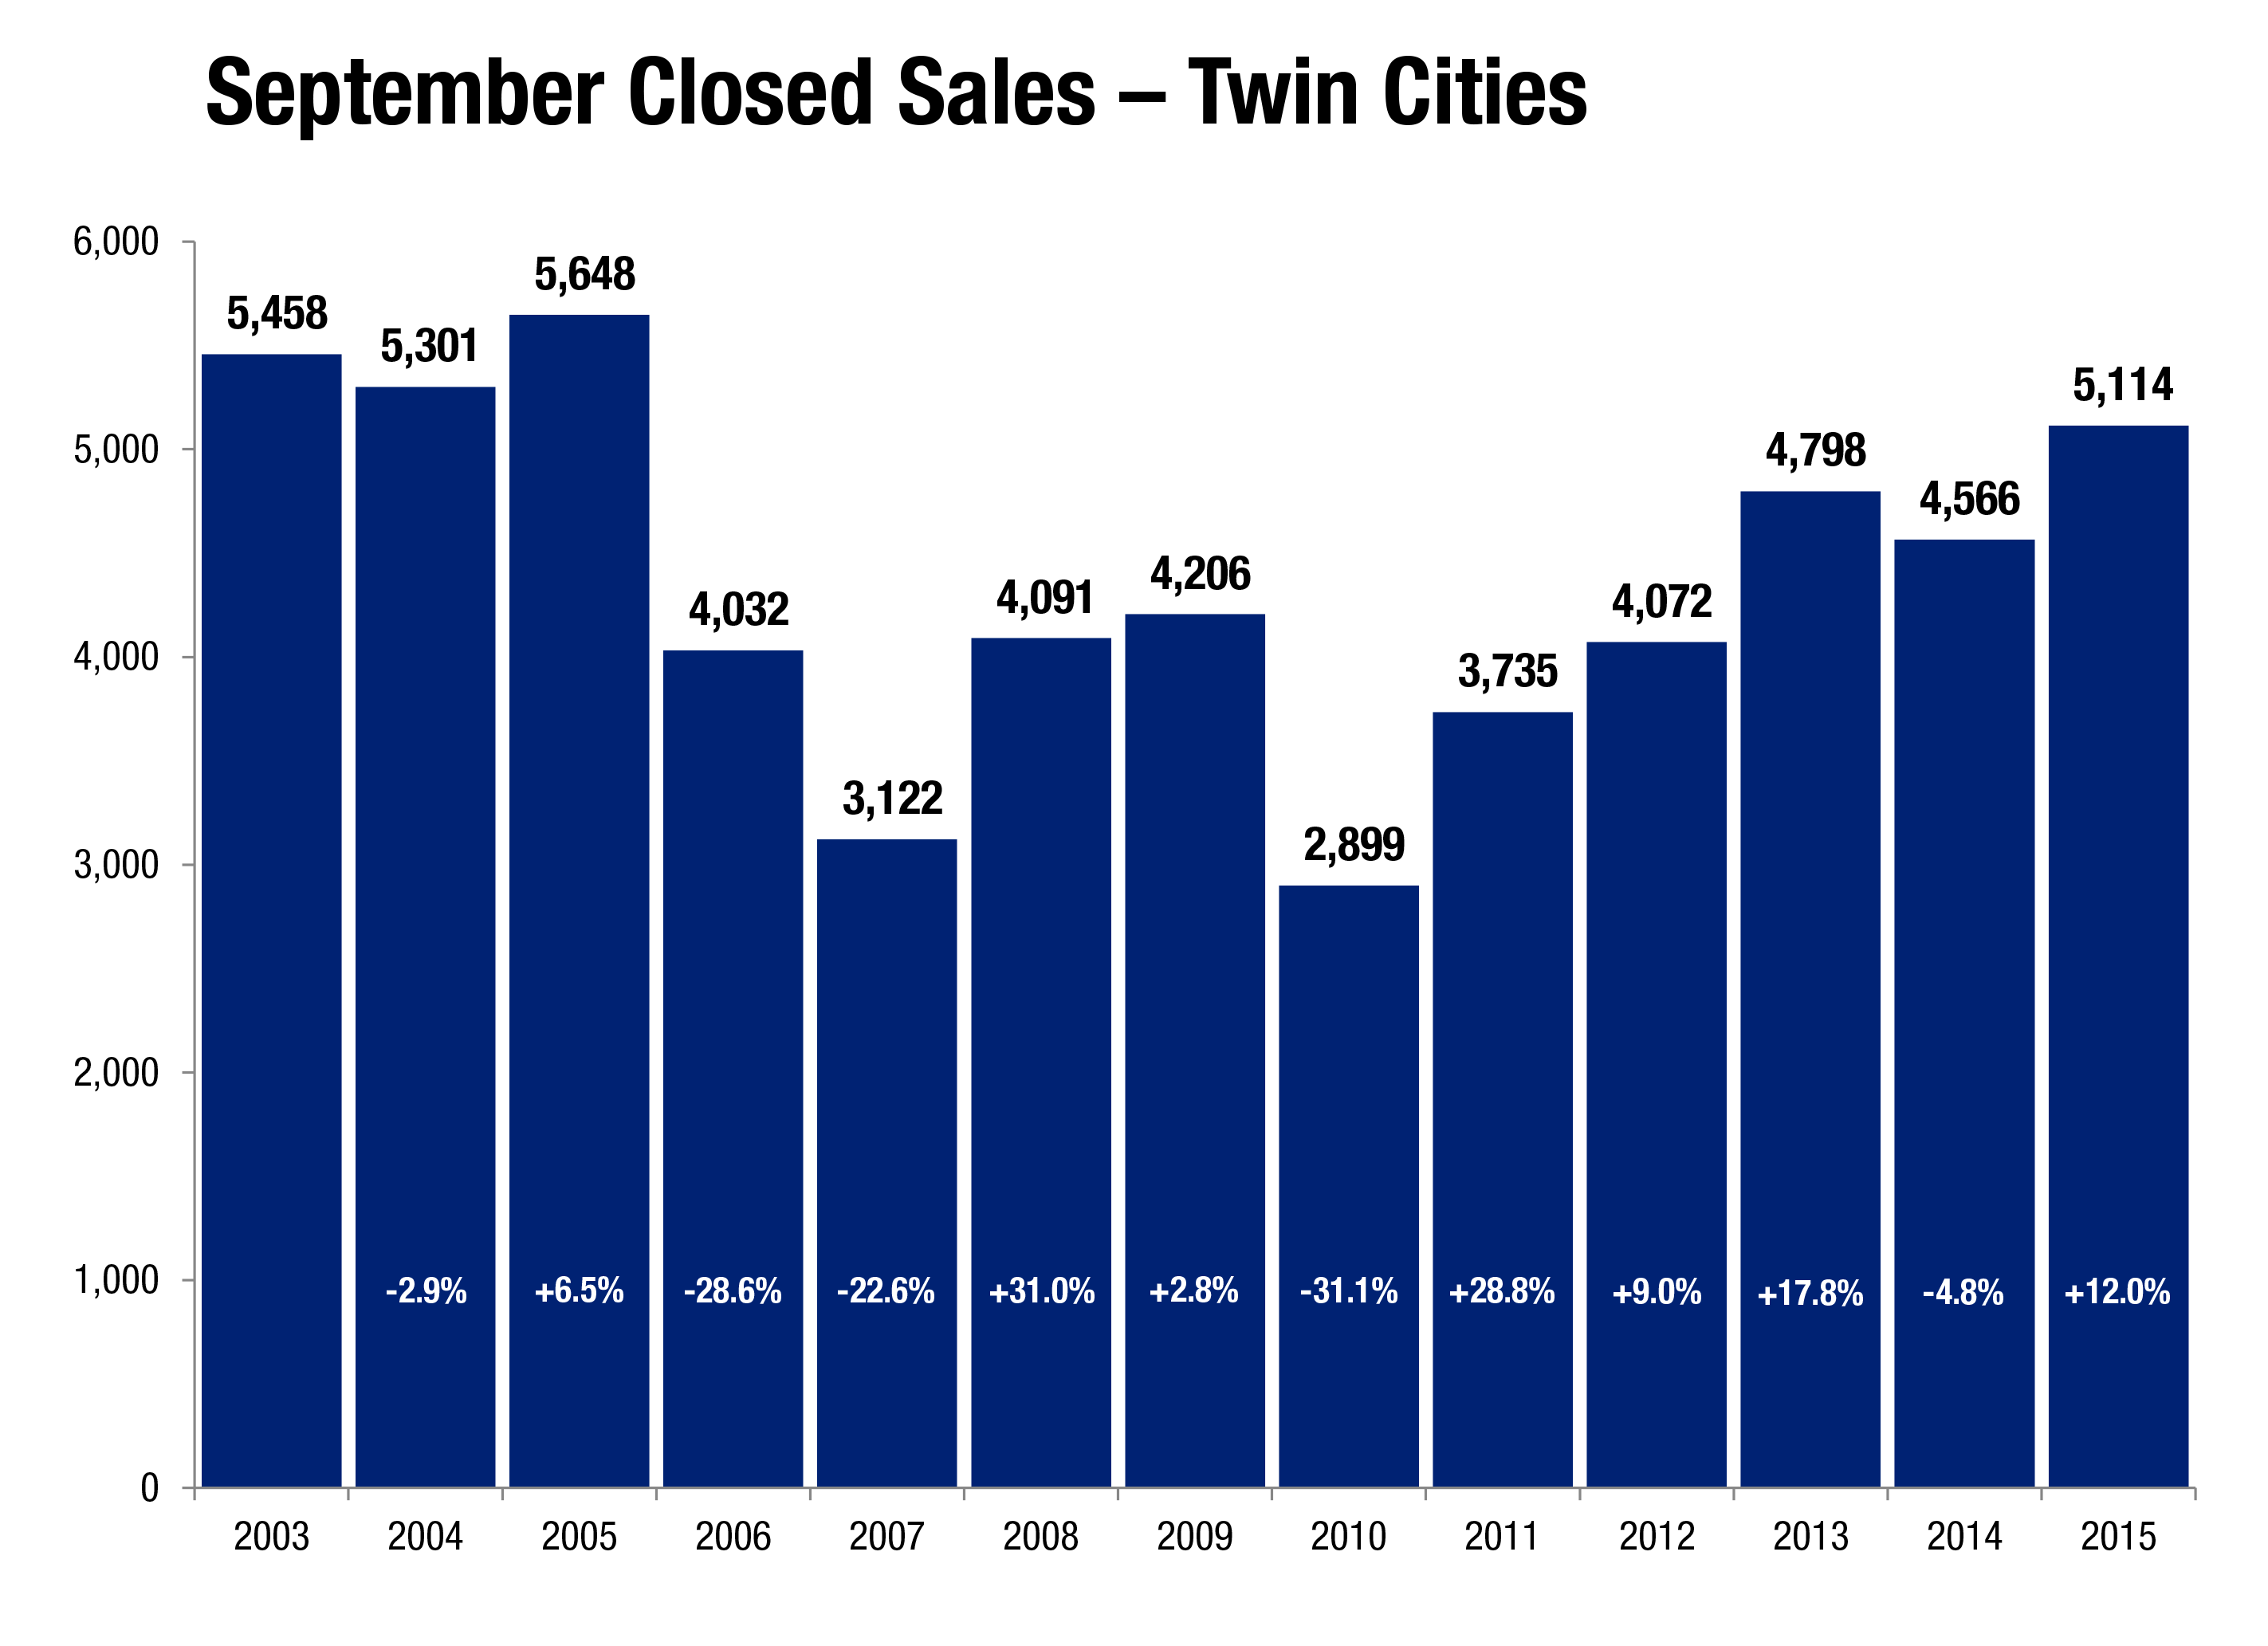
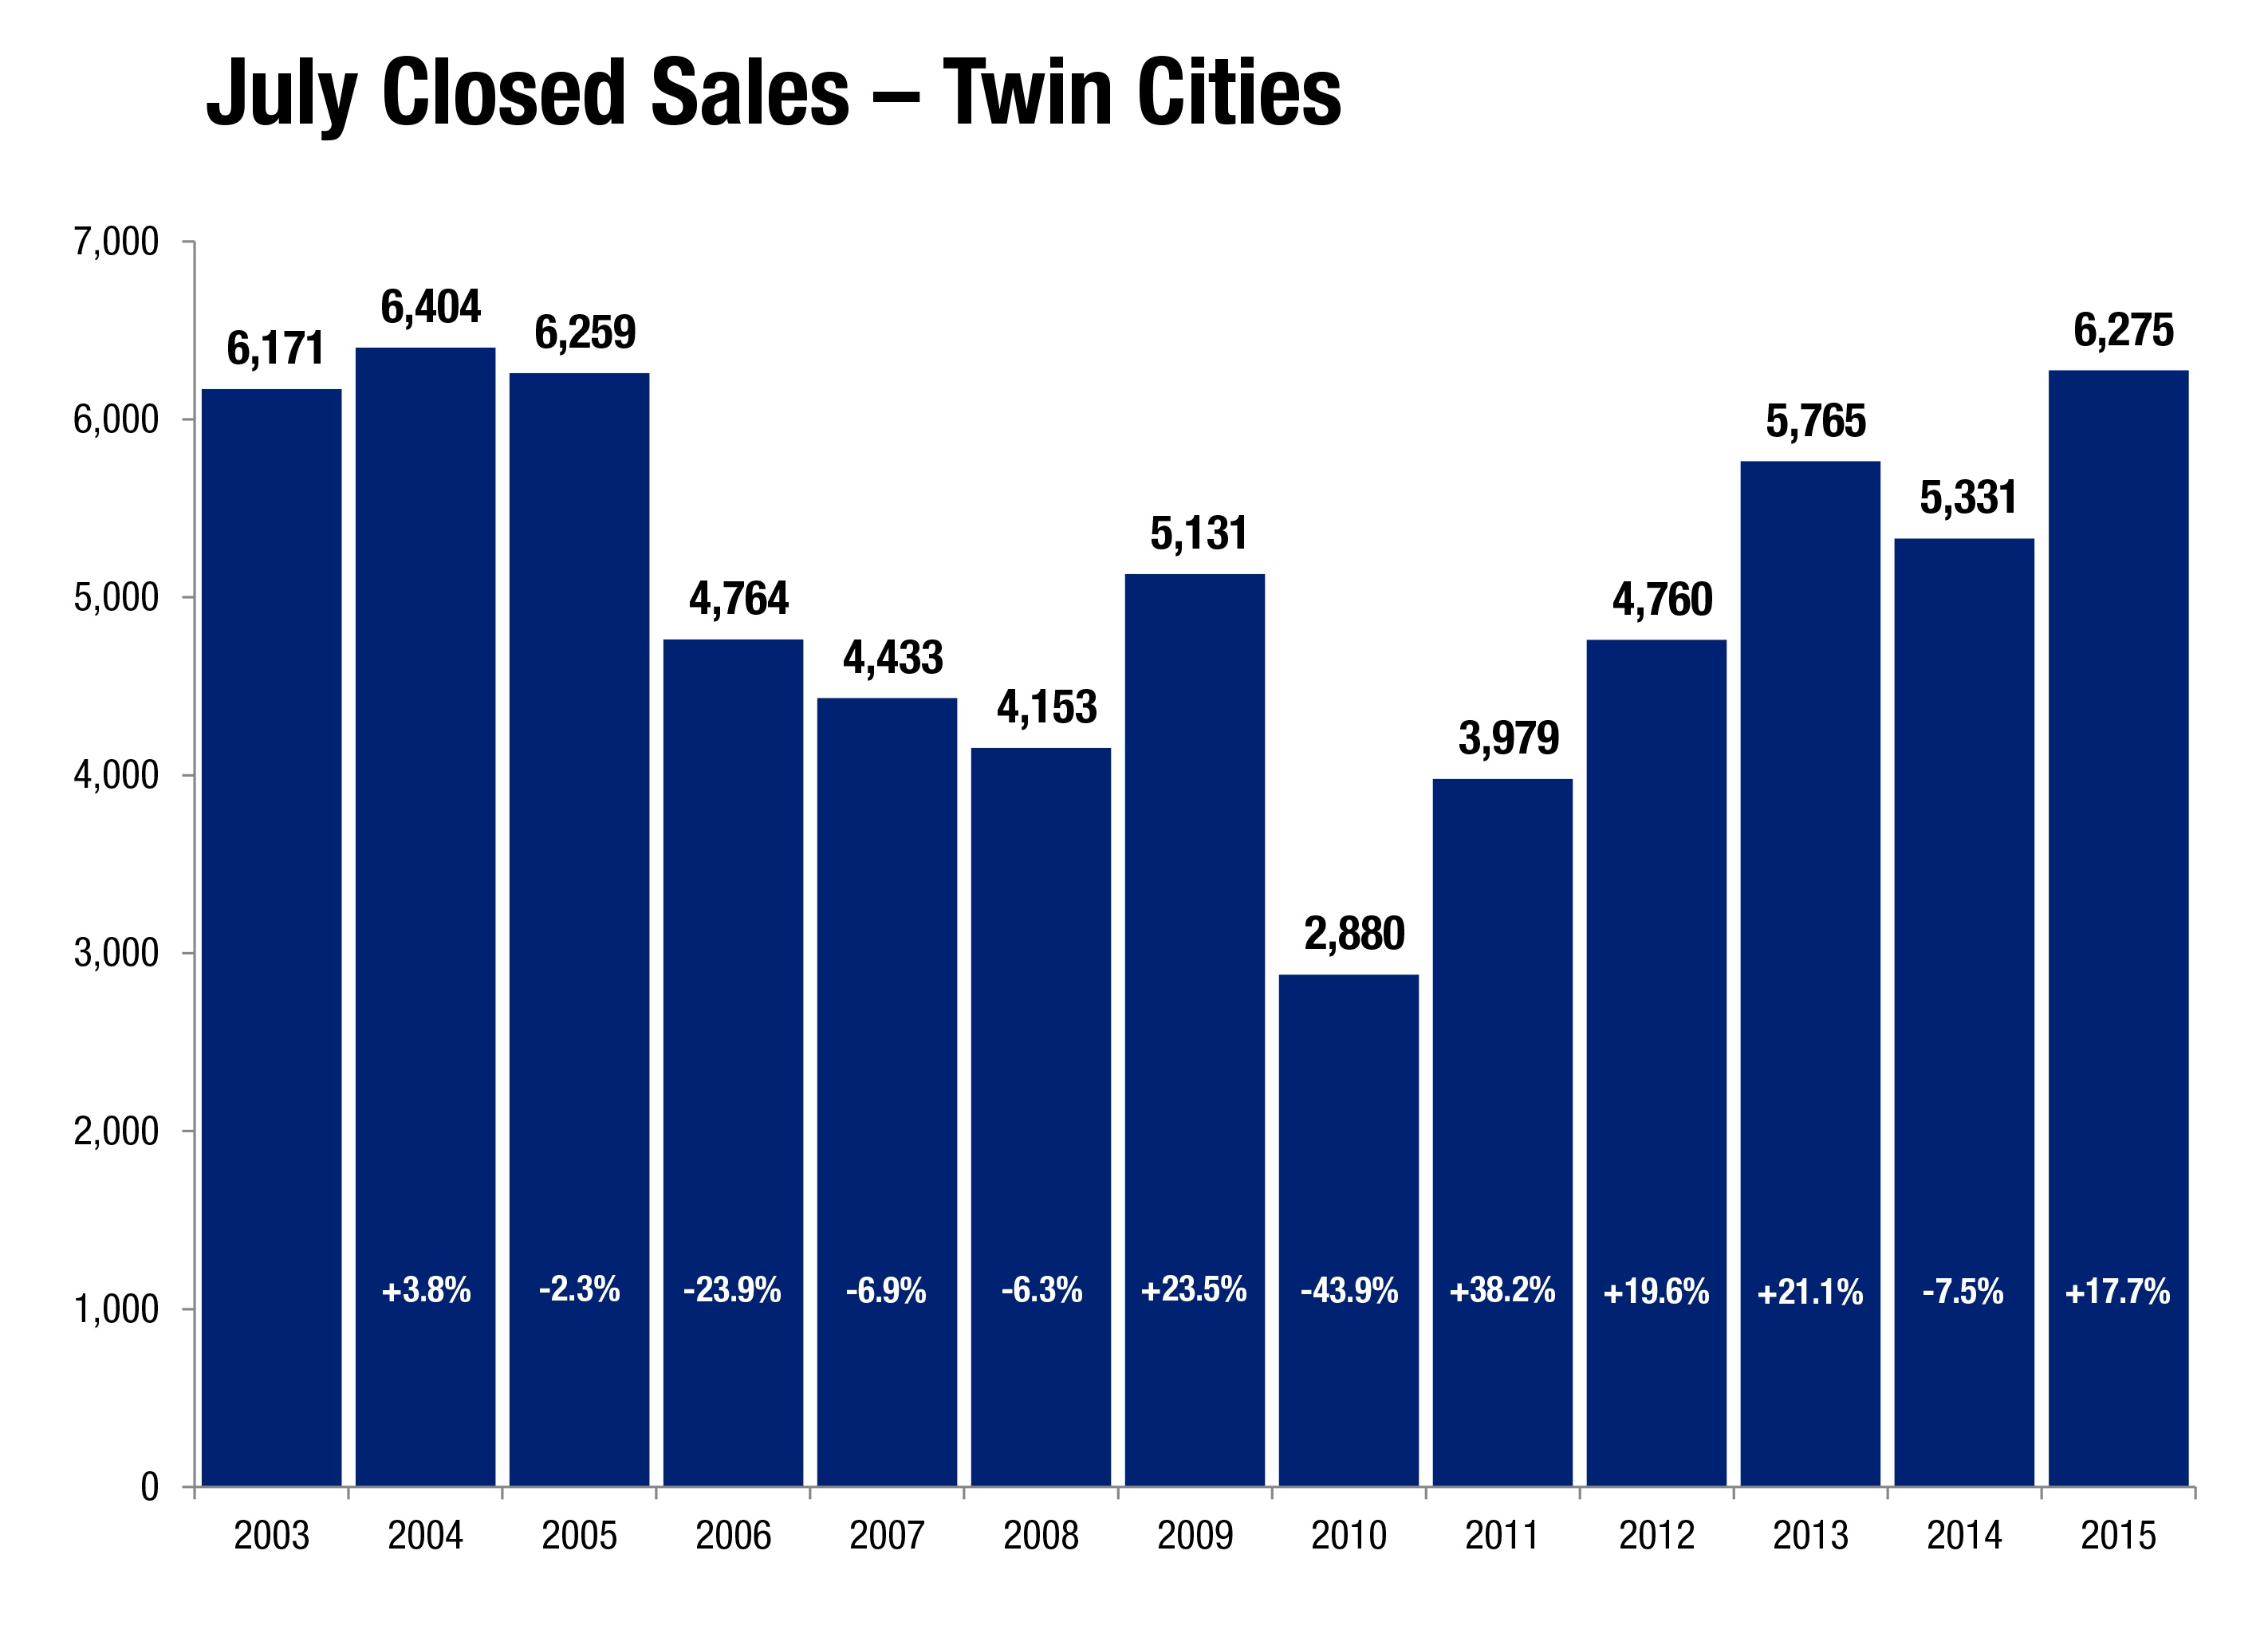
In fact, sales in the 13-county Twin Cities metro area reached a 10-year high in June 2015, no doubt partly triggered by low rates. But what will be the impact of higher (or more normal) rates on our economic recovery, the housing market, savings yields and the stock market? Higher rates aren’t all bad. It means savers will be rewarded more, which will be a positive factor for down payments and consumer financial stability. The economic recovery is accelerating as we’re seeing strong jobs numbers, finally stronger wage growth and consistent GDP growth. Higher rates are unlikely to derail the recovery.

The stock market has begun to price in higher interest rates, but stocks have been quite popular since other investment vehicles aren’t yielding much return due to the rate environment. That could be an area of concern. But the fundamentals remain compelling. Corporate profits near all-time highs, corporate taxes near all-time lows, record valuations driving unprecedented merger and acquisition activity—higher than even the debt-fueled M&A boom before the recession—all suggest the U.S. corporate sector and economy in general will remain an island of stability in a global sea of potential risks.

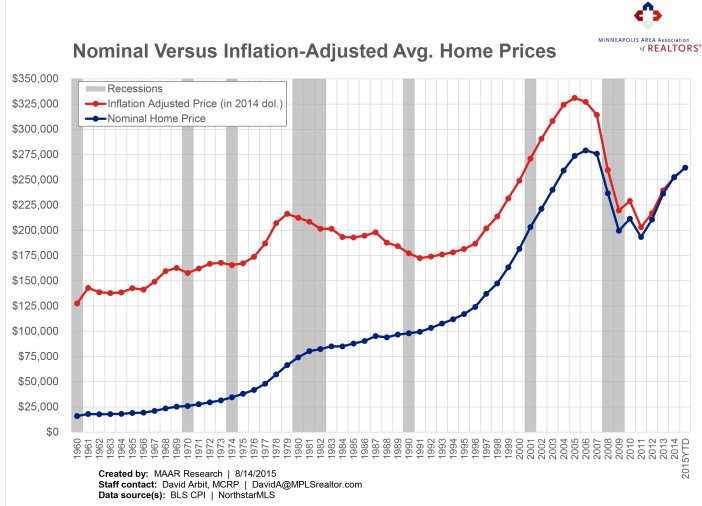
On the housing side, refinancing activity will likely slow, but there is enough organic and pent-up demand out there to support ongoing housing recovery. Many families chose to stay put and weather the downturn. Some adult children who doubled up with mom and dad will forge their own new households. Many renters frustrated by rising rents will enter homeownership to gain equity and better control their housing costs. Price growth should remain positive but the pace has already slowed and returned to historic norms (+4.0% to +7.0% year-over-year). In 2013, the median sales price increased 14.4% compared to 2012. For 2014, that figure was 7.1%, and for 2015YTD it is 7.0%.

So what happens next? The Fed has limited yet effective tools available at its disposable to implement monetary policy. Through open market operations, the discount rate and reserve requirements, it is able to alter the federal funds rate. This is the key rate at which financial institutions (banks, credit unions) actively trade balances held at the Fed with each other. This usually happens overnight and impacts a variety of financial vehicles, including mortgage rates.

FedFundsRate-and-MortgageRate-702x485

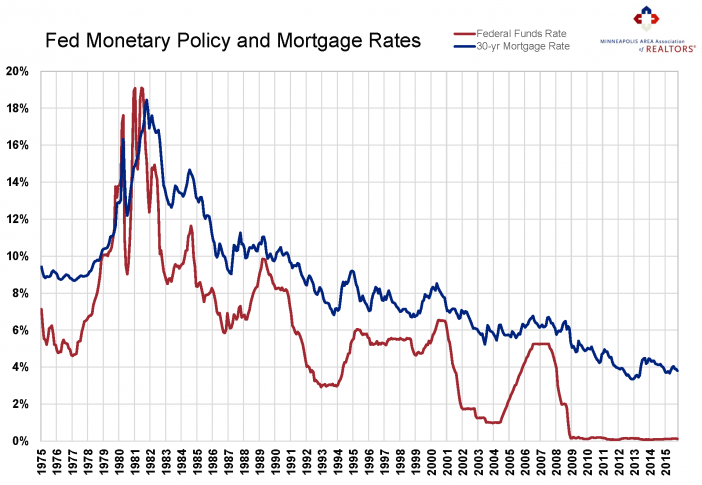
However, a shift in the federal funds rate does not correspond to an equivalent change in the consumer-facing 30-year mortgage rate. The chart above showcases this. Note that large increases in the federal funds rate only correspond to minor and sometimes leading or lagging changes in the mortgage rate. There does seem to be a relationship, but it’s neither as strong nor as direct as many assume.

For example, when the federal funds rate increased from 1.0% to 5.2% between 2004 and 2006, mortgage rates only increased from 5.5% to around 6.5%. In other words, a 420.0% increase in the federal funds rate was only accompanied by a roughly 18.0% increase in rates. That was an unusually large jump in the federal funds rate aimed at slowing an overheating housing market. None of this happens in a vacuum. Many other factors impact mortgage rates, including but not limited to current inflation, future inflation expectations, treasury market dynamics, equity and bond market dynamics, debt levels, the velocity of money, wage pressure, GDP growth, the general economic climate and other forces.

So exactly what does the future hold? Crystal balls are tough to come by these days, but Freddie Mac and others have put out a forecast for mortgage rates through the end of 2016.

FedFundsRate-and-MortgageRate3-702x469

Most economists expect 30-year mortgage rates to reach 4.5% or 4.6% by the end of 2016, compared to just under 4.0% at the end of 2015. That’s a manageable increase and is still well below the long-term average of just over 8.0%. To put that in perspective, the total payment on a $200,000 loan at 4.0% vs. 4.5% amounts to a monthly difference of about $50. While that’s certainly noticeable, most households can stomach it—particularly with additional wage growth and stronger labor force participation.

In the face of declining affordability brought on by rising prices and higher rates, the key will be whether wage growth can neutralize or at least partly offset that effect. Furthermore, in today’s low inventory environment, the other trend to watch will be whether prices continue to rise at a sufficient level to motivate hesitant sellers to list without rising so fast so as to alienate buyers. The most budget-sensitive consumers might make an attempt to get deals done sooner than later, but for most consumers, the difference isn’t enough to drastically change behavior.

Ultimately, the future is unwritten. But given the data coming out of the economy, labor and housing markets and the fact that the dream of homeownership is alive and well, we feel pretty confident that the U.S. economy in general and housing in particular will remain a bright spot.
From The Skinny Blog.

Weather, Job Growth and Rates Boost November Market Activity

By Aubray Erhardt on Friday, December 11th, 2015

With warmer than usual temperatures, impressive job and wage growth and still attractive interest rates, strong home purchase demand continued into November. Pending sales rose 18.1 percent to 3,497 signed contracts; new listings increased 11.5 percent to 3,785 homes. That’s the largest year-over-year increase since June of this year for pending sales, and the largest gain since March for new listings. Inventory levels fell 18.5 percent to 12,984 active units. Persistently low levels of for-sale properties can be a challenge for some buyers. Prices continued to rise as the median sales price gained 7.3 percent to arrive at $219,900. The median list price rose 4.6 percent to $229,995, while the price per square foot rose 6.1 percent to $127.

Due to the low supply and high demand environment, the percent of original list price received at sale was up 1.2 percent to 95.8 percent. Sellers also accepted offers in less time than last November. Days on market declined 7.6 percent to 73 days. Months supply of inventory fell 25.6 percent to 3.2 months—the lowest level on record in almost 12 years. Generally, five to six months of supply is considered balanced. While the metro as a whole is favoring sellers, not all areas, segments or price points reflect that.

“Buyers have truly been out in force this year,” said Mike Hoffman, Minneapolis Area Association of REALTORS® (MAAR) President. “While we’re encouraged by modest increases in seller activity, it’s simply not enough to meet the demand brought on by attractive rates, rising rents and an accelerating labor market. The nice weather has certainly helped.”

Region-wide indicators offer useful insights, but it’s important to dive into individual areas and segments. The percentage of sales that were foreclosure or short sale fell to 11.0 percent as traditional sales rose 21.4 percent. Single-family sales had the strongest gain of any property type, followed by townhomes and condos, respectively. Previously-owned sales increased at nearly twice the rate of new construction. Sales activity in the lowest price range ($150,000 and below) declined 19.3 percent while activity in all other price ranges is rising (homes priced at $400,000 and above had a 15.9 percent sales increase). Though it’s not yet the case for the region, home prices across several local markets including St. Louis Park, Edina and Southwest Minneapolis have reached record highs.

The November jobs numbers beat expectations and were accompanied by upward revisions to September and October. Wages are growing at their fastest pace in six years—an encouraging sign that should offset declining affordability brought on by rising prices and interest rates and facilitate larger down payments. The latest Bureau of Labor Statistics figures also show the Minneapolis-St. Paul-Bloomington metropolitan area had the lowest unemployment rate of any major metro area at 3.1 percent compared to 5.0 percent nationally. Mortgage rates are still around 4.0 percent compared to a long-term average of about 8.0 percent. A rate hike at the Federal Reserve is widely expected in December, though changes in mortgage rates will be slow and incremental and shouldn’t disrupt the recovery.

“With all but one month of 2015 in the books, we’re really starting to see how the year will stack up,” said Judy Shields, MAAR President-Elect. “Since consumer demand for housing has fully recovered, the seller component is still the missing puzzle piece.”
From The Skinny Blog.

Buyers Active, Sellers Staying Put, Price Gains in Line with Historical Norms

By Erin Milburn on Tuesday, November 17th, 2015

October pending sales rose 3.3 percent to 4,331 contracts. New listings decreased 2.6 percent to 5,798 as fewer sellers listed their properties for sale. It should come as no surprise that inventory levels fell 16.7 percent to 14,911 active units—extending a long-standing supply crunch that is frustrating some buyers but helping sellers yield multiple offers. As one might expect, prices thus continued to rise with the median sales price increasing 4.9 percent compared to last October. That is wholly in line with long-term year-over-year appreciation before factoring for inflation. The median list price rose 4.4 percent to $240,000, while the average price per square foot rose 3.2 percent to $127.

With tight supply and strong demand, sellers accepted a larger share of their original list price as offers were more competitive. The percent of original list price received at sale was up 1.1 percent to 96.2 percent. Homes tended to sell in less time. Days on market declined 2.8 percent to 70 days. Both of these trends are consistent with a sellers market. Further evidence that it’s a good time to sell came by way of months supply of inventory, which fell 25.6 percent to 3.2 months of supply. Generally, five to six months of supply is considered balanced. While the metro as a whole is favoring sellers, not all areas, segments and price points reflect that.

“Sellers are still a bit hesitant,” said Mike Hoffman, Minneapolis Area Association of REALTORS® (MAAR) President. “That said, factors such as low interest rates, rising rents, prices still below their peak and accelerating job and wage growth also paint a compelling picture for buyers.”NL-PS_blog-702x508

Other market measures show ongoing improvements as well. The percentage of all sales that were foreclosure or short sale has shrunk to less than 10.0 percent. Sales activity in the lower price ranges ($150,000 and below) is declining while activity in all other price ranges is rising. At the high end of the market, year-to-date sales activity in the $1,000,000 and up range has reached all-time record highs. Though it’s not yet the case for the entire region, home prices across several local markets including St. Louis Park, Edina and Southwest Minneapolis have also reached record highs.

The broader economy has been favorable to market recovery. The October jobs report not only beat expectations but it also showed the strongest wage growth in six years—a critical factor that will offset declining affordability and help with down payments. Unemployment has been cut in half from its peak and consumer confidence is rising. October Bureau of Labor Statistics figures show the Minneapolis-St. Paul-Bloomington metropolitan area had the lowest unemployment rate of any major metro at 3.1 percent compared to 5.0 percent nationally. Mortgage rates are still around 4.0 percent compared to a long-term average of over 7.0 percent. A rate hike at the Federal Reserve is expected in December, though changes in mortgage rates will be slow and incremental.

“As we near the end of 2015, it’s clear that home buyers were motivated and eager to make their move,” said Judy Shields, MAAR President-Elect. “Moving forward, we’ll be watching the affordability environment, inventory levels and new construction as we adapt to changing consumer preferences and a changing interest rate climate.”
From The Skinny Blog.

Twin Cities Housing Strong Heading into Fall

By Erin Milburn on Tuesday, October 13th, 2015

After an impressive summer, Twin Cities home sales continued at a 10-year record pace in September. Most indicators are beginning to show month-to-month moderation although year-over-year comparisons remain positive. The number of closed sales rose 12.0 percent to 5,114 homes. Fewer sellers listed their properties than last September, as new listings decreased 6.9 percent to 6,355. Inventory levels fell 16.0 percent to 15,928 active units. Prices continued to rise with the median sales price up 8.3 percent over last year.

Other price measures also continued to perform well. The median list price rose 2.1 percent to $245,000; while the average price per square foot rose 6.3 percent to $129. Sellers enjoyed their position of strength in the marketplace as the percent of original list price received at sale rose 1.0 percent to 96.6 percent. At 4,635 contracts signed, pending purchase activity also remains strong—12.3 percent above last September’s levels. On average, homes sold in less time. Days on market declined 8.5 percent to 65 days. This is consistent with a market leaning slightly towards sellers. Months supply of inventory fell a significant 26.1 percent to 3.4 months of supply. Generally, five to six months of supply is considered balanced. While the metro as a whole is favoring sellers, not all areas, segments and price points reflect that. Sept-Closed-Sales_2015-10
“September was another strong month for buyer activity,” said Mike Hoffman, Minneapolis Area Association of REALTORS® (MAAR) President. “Seller activity, however, remains restrained, meaning those who do choose to sell are getting top dollar in near-record time. The demand for homes is still exceeding the supply.”

Strong demand and low supply levels have created an environment where competitively-priced homes sell quickly and sometimes with multiple offers. This supply-demand imbalance, along with the “product mix shift” back to traditional sales, also means prices have risen for 43 consecutive months. The September 2015 median sales price rose 8.3 percent to $222,000 compared to a year-to-date increase of 6.8 percent to $220,000. Sellers are accepting offers at a median of 99.2 percent of their final list price.

Since housing doesn’t occur in a vacuum, it depends on other economic forces like a recovering labor market, job growth, favorable interest rates and confident consumers. Those factors have helped support our recovering housing market. We’re in the midst of the longest stretch of private job growth on record, unemployment has been cut in half from its peak and consumer confidence is rising. The latest Bureau of Labor Statistics figures show the Minneapolis-St. Paul-Bloomington metropolitan area had the second lowest unemployment rate of any major metro at 3.3 percent compared to 5.1 percent nationally. Mortgage rates are around 4.0 percent, compared to a long-term average of over 7.0 percent. The Federal Reserve is committed to lifting their key Federal Funds rate, a major factor affecting mortgage rates.

“We expect interest rates to stay below their long-term average for years to come,” said Judy Shields, MAAR President-Elect. “The trick will be sustaining price gains that motivate enough sellers to list their properties without pricing out today’s buyers—particularly first timers.”
From The Skinny Blog.

The Inflatable Price Raft

By David Arbit on Tuesday, August 18th, 2015
InflatableRaftPrice_-01-702x327Screen shot 2015-08-20 at 12.51.28 PM

“Accept certain inalienable truths: Prices will rise. Politicians will philander. You, too, will get old. And when you do, you’ll fantasize that when you were young, prices were reasonable, politicians were noble and children respected their elders.” – Mary Schmich

We hear a lot about home prices and how they change over time. But by far the biggest pitfall of dealing in absolute dollar terms is that a dollar in 2015 does not buy what a dollar used to get you in 1960 or even in 2010. If you’ve ever purchased the same product or service even just several years apart, you implicitly know this, though you may not be familiar with some of the rationale and technical aspects of tracking and adjusting for inflation. And let’s be clear here: that is ok!

While the nominal (not inflation-adjusted) home price has certainly increased in absolute terms, the typical home that cost $15,977 in 1960 dollars would actually cost exactly $127,635 in 2014 dollars. So a lot of what appears to be price gains is actually attributable to inflation, though not all of it. This is why it’s important to separate out inflation-adjusted prices from nominal, reported prices. It’s the best way to answer the question: excluding the effect of inflation, how much did real home prices actually increase?

The Consumer Price Index (CPI) is the most common method to account for inflation when dealing with time-series data stated in currency units. Using the Bureau of Labor Statistics (BLS) CPI, we’ve adjusted historic home prices and restated them in constant 2014 dollars. Note how far apart the trendlines start versus where they end up. Only when nominal prices approach 2014 do the trendlines converge—since, at that point, both nominal and adjusted prices are stated in 2014 dollars.

Enough with the buildup. So what’s really going on here?

Between 1960 and 2015, nominal home prices increased from $15,977 to $261,963, a gain of 1,539.6 percent. During the same period, inflation-adjusted prices increased from $127,635 to the same $261,963 for a more modest gain of 105.2 percent. That’s a big difference, and shows just how much of the run-up in prices can be attributed to inflation.

But it’s also important to note that home prices more than doubled during the 54 year study period (1960-2014) even after adjusting for inflation and despite the downturn. That means after factoring for inflation, home prices kept pace with inflation AND doubled in 54 years. An increase of 105.2 percent spread out across 54 years translates into a 1.95 percent real annualized average growth rate. That finding supports the roughly 2.0 percent annual home price increase that is referenced quite often. It also supports the fact that real estate is an effective inflation hedge.

Equally or perhaps even more importantly, while nominal home prices are quickly nearing their 2006 highs, inflation-adjusted or real home prices are still well below their previous peak in 2005. In other words, while nominal prices seem to be approaching their previous peak, real home prices are still a bargain, especially compared to 2004-6 prices stated in 2014 dollars. That means real home prices have to increase 26.4 percent before they break even with 2005 levels. Nominal home prices have about 6.6 percent to go before reaching 2006 levels.

But life is all about choices, and choices—at least in the strict economic sense—represent a series of opportunity costs. An opportunity cost of a choice, such as buying a house, is what you give up to get it. Most of us have to choose between two major investments at any given time. Sure, gold and other precious metals might also keep pace with inflation and then some, but you can’t live in a pile of bullion. You can only visit your gold periodically. Investing in a home is one of the most effective inflation hedges out there. Plus, while you’re quietly slaying the inflation dragon and enjoying some appreciation, you’ve got a place to live!
Inflation-Chart1-702x506 From The Skinny Blog.

Housing Continues to Delight as Summer Activity Starts to “Cool”

By Erin Milburn on Thursday, August 13th, 2015

Minneapolis, Minnesota (August 13, 2015) – After purchase demand reached a 10-year record high in June, the Twin Cities metropolitan housing market continued to delight in July. With the spring and summer peak buying season coming to a close, activity levels should begin to cool month-to-month, though most indicators should continue to show year-over-year improvement. The number of signed purchase agreements rose 12.1 percent to 5,716 for July, but are up 18.7 percent so far in 2015. Closed sales increased 17.7 percent to 6,275, but have risen 16.7 percent so far this year. Seller activity was flat compared to last July, new listings fell just 0.4 percent from 7,997 to 7,963. Given that combination of supply and demand movement, the number of available properties for sale fell 11.0 percent to 16,940 homes.

08-12-2015_MAAR-PR-CS

“While those selling their home are yielding top dollar, others wonder if today’s younger generation will be renters forever,” said Mike Hoffman, Minneapolis Area Association of REALTORS® (MAAR) President. “But a National Association of REALTORS® (NAR) survey found that millennials comprised 32.0 percent of all home buyers and 68.0 percent of first-time buyers—both the largest share of any group.”

As interest rates continue to normalize this year, even more pent-up demand from all age brackets will likely be released during this period of historic affordability.

Since demand increased while supply indicators fell—and because a larger share of sales came from the higher-priced traditional segment—the July 2015 median sales price rallied another 4.7 percent to $225,000. The median price per square foot increased 3.4 percent to $120. While the July 2015 median sales price was slightly lower than the June 2015 price, the July 2015 price per square foot was slightly higher than June 2015.

Again due to the factors mentioned above combined with a sense of urgency among buyers, the number of days a property spent on the market fell 7.4 percent to 63 days. Sellers are accepting offers at a median of 98.5 percent of their original list price but 99.7 percent of their final list price, suggesting near-full price offers come quickly once a seller is priced right.

The Twin Cities metropolitan area has 3.7 months’ supply of inventory, which means the region as a whole is a seller’s market. That figure dropped 19.6 percent since July 2014. However, not all local areas, market segments and price points reflect that metropolitan-level reality. This metric is a ratio of supply and demand and indicates how long it would take to completely clear the market assuming no new homes enter the marketplace.

Barring suddenly negative economic data, the Federal Reserve is poised to normalize rates by lifting the Federal Funds rate off of zero starting in September. Mortgage rates are still just below 4.0 percent, compared with a long-term average of over 7.0 percent. Nationally, the economy added 215,000 new private payrolls in July while the unemployment rate held steady at 5.3 percent. The most recent data from the Bureau of Labor Statistics shows the Minneapolis-St. Paul-Bloomington metropolitan area has the third lowest unemployment rate of any major metro.

“We have so many different things going for our region,” said Judy Shields, MAAR President-Elect. “Twin Citizens are smart, and they realize that when rents are high and rising, interest rates are under 4.0 percent and prices are still below their peak, it’s time to consider investing in the stability and predictability of homeownership—in most cases, it’s cheaper than renting.”

From The Skinny Blog.

Where are the lowest prices?

By David Arbit on Wednesday, August 5th, 2015

Though not quite as often as the most expensive areas, we are also occasionally asked which cities are the most affordable (least expensive). Below are tables showing the 25 lowest priced markets in the region. The top two tables rank all areas, regardless of market size. The bottom two tables only show areas with a certain volume of sales. The left table uses only June 2015 sales, while the table to the right uses 2015 YTD data (through June). The measure used is still median sales price.

Even more data to the people!

Lowest-Priced-Cities-7-2015-702x485

Lowest-Priced-Cities-7-2015-with-restrictions-702x501
From The Skinny Blog.