Author Archives: Pat Delaney

Weekly Market Report

The prevailing trend continues to be more showings, more offers, higher prices and faster sales, with inventory becoming a growing problem — or rather, a shrinking problem. There aren’t enough homes to choose from for hungry buyers eager to get in while the gettin’ is good. Meanwhile, rents are on the rise and there is a rising sense of improvement for new construction projects. With national unemployment down to 7.7 percent, there is a springy breeze in the air for better days ahead, even in the face of increased taxes and higher cable TV prices.

In the Twin Cities region, for the week ending March 2:

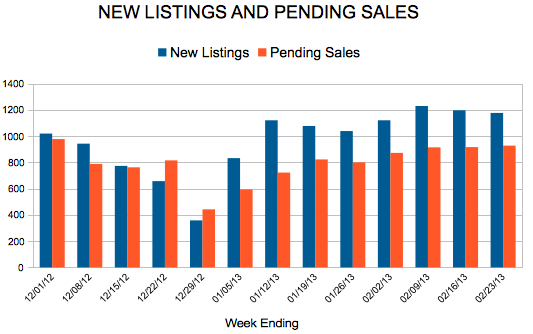
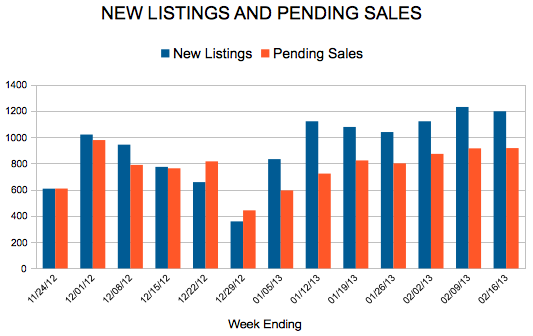
  • New Listings increased 0.9% to 1,422
  • Pending Sales increased 12.0% to 1,001
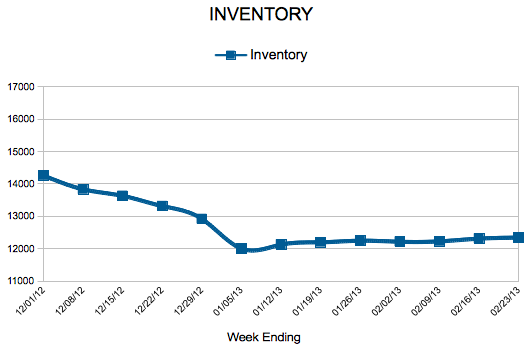
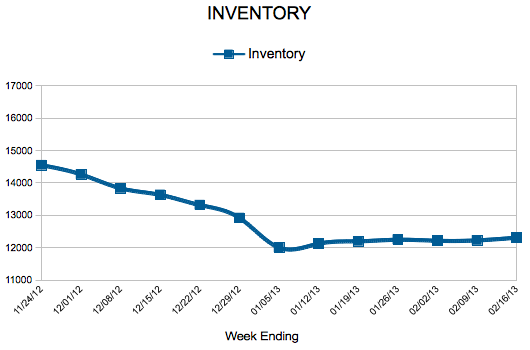
  • Inventory decreased 31.0% to 12,371

For the month of February:

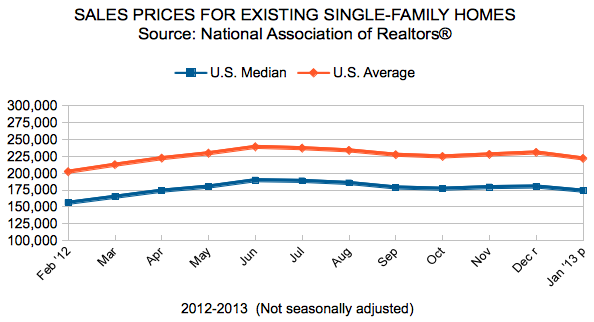
  • Median Sales Price increased 15.5% to $160,000
  • Days on Market decreased 22.2% to 112
  • Percent of Original List Price Received increased 3.4% to 93.7%
  • Months Supply of Inventory decreased 40.8% to 2.9

Click here for the full Weekly Market Activity Report.From The Skinny.

Weekly Market Report

REALTORS® must sell. Whether it’s themselves, a property or an offer, an integral part of the life is convincing other people of something. Clean clothes, shiny shoes, a tucked shirt, upright posture. That’s just to get in the door. But it’s not enough to walk the talk. Proving to be the real(TOR®) deal means you know your stuff. You need stats, real stats, GOOD stats. Impress with empirical industry know-how and dazzle with substantiated evidence. Don’t be the kid in class with grass stains, gum in hair and an unsharpened No. 3 pencil. Bring the following local real estate expertise to the local listing presentation.

In the Twin Cities region, for the week ending February 23:

  • New Listings decreased 6.1% to 1,176
  • Pending Sales increased 3.1% to 927
  • Inventory decreased 30.9% to 12,341

For the month of January:

  • Median Sales Price increased 14.3% to $160,000
  • Days on Market decreased 24.1% to 107
  • Percent of Original List Price Received increased 2.5% to 93.5%
  • Months Supply of Inventory decreased 40.0% to 3.0

Click here for the full Weekly Market Activity Report.From The Skinny.

Weekly Market Report

Here’s an oldie but goodie: All Real Estate is Local. We’ve all heard it. It’s why industry insiders don’t pay much attention to national housing statistics. The national housing market is just an agglomeration of local housing markets. It’s like saying there is a national garage sale market. They’re all local. You don’t grab an umbrella in Miami based on the weather forecast in Seattle. So why would someone in San Francisco base a home sale or purchase decision on market data from Boston? Here’s your data for your local housing market.

In the Twin Cities region, for the week ending February 16:

  • New Listings decreased 4.9% to 1,196
  • Pending Sales increased 7.9% to 916
  • Inventory decreased 31.0% to 12,309

For the month of January:

  • Median Sales Price increased 14.3% to $160,000
  • Days on Market decreased 24.1% to 107
  • Percent of Original List Price Received increased 2.5% to 93.5%
  • Months Supply of Inventory decreased 40.0% to 3.0

Click here for the full Weekly Market Activity Report.From The Skinny.