Category Archives: The Skinny

Home Prices and Mortgage Payments: A slightly complicated tango

By David Arbit on Friday, September 22nd, 2017

Since home prices for the Twin Cities metro have fully recovered and then some, it’s tempting (and even somewhat logical) to assume that monthly mortgage payments are also at all-time highs. That assumption would be entirely inaccurate. But it makes so much sense! If the median home price is at an all-time high, the monthly mortgage payment on that median priced home must therefore also be at an all-time high. Nope. Still false.

What this assumption fails to account for is of course mortgage or interest rates. The last time prices were this high, in 2006, the 30-year fixed mortgage rate was about 6.5 percent. In 2017, rates are averaging around 4.0 percent. That’s where this all-too-common assumption falls flat on its face.

The monthly payment on the median-priced home in 2006 was $1,715, but is only $1,498 in 2017, thanks to rates being 2.5 percentage points lower (6.5 vs 4.0). The median home price, however, has now reached $247,000 compared to $230,000 in 2006. So while affordability has declined since 2012, it still remains above 2004-2007 levels. In other words, despite prices being higher today than in 2006, monthly payments on purchased homes are still below where they were during the housing bubble.
Prices-vs-Payments2-702x503
From The Skinny Blog.

Inventory Crunch Weighing on Sales Activity

By Erin Milburn on Monday, September 18th, 2017

Minneapolis, Minnesota (September 18, 2017) – The Twin Cities housing market continues to show signs of high demand and short supply. While June 2017 marked an all-time home sales record for the Twin Cities, closed sales showed a year-over-year decline for the second consecutive month. The number of sellers listing their homes increased slightly, but that wasn’t enough to counteract the inventory drop. New listings increased 0.7 percent from last year to 7,264, and closed sales dipped 1.4 percent. The number of homes for sale decreased 16.7 percent to 12,602. Factoring out foreclosures and short sales, traditional new listings rose 2.4 percent while traditional closed sales increased 0.9 percent.

With many consumers competing for limited homes, prices remained firm, a trend that should continue into the fall and winter months. The median sales price rose 6.8 percent from last year to $252,000—a new monthly record for August. Home prices have now risen for the last 66 consecutive months or 5.5 years. At 48 days on average, homes went under contract 14.3 percent faster than last August. Sellers who do list are averaging 98.5 percent of their original list price, 0.6 percent higher than August 2016. The metro area has just 2.5 months of housing supply. Generally, five to six months of supply is considered a balanced market where neither buyers nor sellers have a clear advantage.

“The shortage of homes for sale is still driving this market,” said Cotty Lowry, Minneapolis Area Association of REALTORS® (MAAR) President. “It’s been the story for years, and it continues to influence prices, sales, market times and other indicators. The graphic illustrates how listings and sales have converged, leaving very little product lingering on the market.”
August-PR-Image-702x491
The shortage is most acute for entry-level homes. Well-priced, turnkey, well-presented listings are most competitive. Market times and absorption rates are tightest for homes priced under $200,000. For example, homes between $150,000 and $190,000 had 1.4 months of supply. As you move up the price ladder, the market is less competitive and better supplied. Homes priced between $500,000 and $1,000,000 boast 6.0 months of supply, while homes over $1,000,000 have a plentiful 12.3 months of supply.

The most recent national unemployment rate is 4.4 percent, though it’s 3.3 percent locally—the fourth lowest unemployment rate of any major metro area. A thriving and diverse economy has been conducive to housing recovery, as job and wage growth are key to new household formations and therefore housing demand. The Minneapolis–St. Paul region has a resilient economy with a global reach, a talented workforce, top-notch schools, exposure to the growing technology and healthcare fields, and a quality of life that’s enabled one of the highest homeownership rates in the country.

The average 30-year fixed mortgage rate has declined from 4.3 percent to 3.8 percent recently, still well below its long-term average of around 8.0 percent. Although at least one more rate hike was expected this year, the Fed is now focused on unwinding its large portfolio. Additional inventory is still needed in order to offset declining affordability brought on by higher prices and interest rates.

“We’re always impressed by how determined buyers are, despite the supply hurdle,” said Kath Hammerseng, MAAR President-Elect. “That said, prices are rising faster than incomes and builders are focusing on higher-end product further out while the demand is strongest for affordable product closer in.”

Questions? Contact David Arbit, MAAR’s Director of Research + Economics | davida@mplsrealtor.com
From The Skinny Blog.

Pricing strong, but shortage continues to hold back market activity

By Erin Milburn on Tuesday, August 15th, 2017

While June 2017 marked an all-time home sales record for the Twin Cities, closed sales retreated slightly in July compared to 2016. A slow-down in sellers listing their homes was a contributing factor, as was low inventory. New listings decreased 3.9 percent from last year to 7,227, and the number of homes for sale decreased 18.3 percent to 12,407. That was the largest inventory decline in five months. Pending sales declined 1.2 percent to 5,661, and closed sales were down 2.6 percent to 6,020. Factoring out foreclosures and short sales, traditional pending sales increased 0.7 percent to 5,484.

Weak supply and robust demand tend to encourage rising prices. The median sales price rose 5.9 percent from last year to $254,000—a new monthly record for July. Home prices have now risen for the last 65 consecutive months. At 44 days on average, homes went under contract 18.5 percent faster than last July. Despite there being fewer of them, sellers who have listed their homes recently are receiving strong offers in less time. The average percent of original list price received at sale was 99.2 percent, 0.8 percent higher than July 2016. The metro area has just 2.5 months of housing supply. Generally, five to six months of supply is considered a balanced market where neither buyers nor sellers have a clear advantage.

“The market is always adjusting to changing conditions,” said Cotty Lowry, Minneapolis Area Association of REALTORS® (MAAR) President, “Although we saw a nice gain in new construction listings in July, that segment is typically a few years behind and is a drop in the bucket compared to the existing resale market where sellers have felt stuck with nowhere to go.”
2017-08-PR-Image-702x486
Not only is the move-up market less competitive than the entry-level price points, but move-up sellers are getting strong offers on their homes in record time. Because of the fast pace of the market and lack of inventory, it’s extremely rare for sellers to carry two mortgages for more than a month.

A thriving and diverse local economy has been conducive to housing recovery, as job growth is key to new household formations. The most recent national unemployment rate is 4.3 percent, though it’s 3.5 percent locally. The Minneapolis–St. Paul region has a resilient economy with a global reach, a talented workforce, top notch schools, exposure to the growing technology and healthcare fields, and a quality of life that’s enabled one of the highest homeownership rates in the country.

The average 30-year fixed mortgage rate has declined from 4.3 percent to 3.9 percent recently, still well below its long-term average of around 8.0 percent. Excluding any surprising data or events, the Federal Reserve is likely to increase their target federal funds rate at least once more this year. Additional inventory is needed in order to offset declining affordability brought on by higher prices and interest rates.

“The fact that buyers are hardly phased by the lack of inventory speaks to the appeal of homeownership and of our region,” said Kath Hammerseng, MAAR President-Elect. “The current environment calls for additional patience, persistence and compromise, but Minnesotans are known for those traits.”

All information is according to the Minneapolis Area Association of REALTORS® (MAAR) based on data from NorthstarMLS. MAAR is the leading regional advocate and provider of information services and research on the real estate industry for brokers, real estate professionals and the public. MAAR serves the Twin Cities 13-county metro area and western Wisconsin.
From The Skinny Blog.

Seasonal Adjustments

By David Arbit on Friday, August 4th, 2017

Given the fact that the school year is about a month away (yikes) and we’ve already had our first preview of fall weather, it feels like a good time to talk about seasonality. First of all, whatever you do, don’t use the term “seasonably adjusted.” Second of all, don’t make matters worse by talking about the “seasonably adjusted medium sales price.” That’s not a thing.

All kidding aside, both agents and the public have a vested interested in knowing how and when listings, inventory levels, purchase agreements and closed sales ebb and flow throughout the year. Ever been asked the question or wondered “when do the most new listings come on the market?” Or “when do buyers write the most offers?” Or how about “what month tends to have the greatest number of homes for sale?”

These are legitimate and important questions that can inform a variety of market-related strategies. Technically, April sees the highest volume of new listings, but buyers have the greatest number of choices in July. Signed purchase agreements peak in June along with closed sales. The shape of the seasonal curves can also be revealing. Seller activity tends to ramp up quickly in March and April and then quiet down rapidly starting in October. New listings are front-loaded in the first half of the year. Buyer activity, particularly pending sales, tends to follow more of a “normal” or even distribution throughout the year.
Seasonality-702x507
From The Skinny Blog.

Sales and prices hit new highs, despite inventory constraints

By Erin Milburn on Tuesday, July 18th, 2017

Despite the decelerating gains in buyer activity, June 2017 was a new record high for home sales in the Twin Cities. Compared to last June, closed sales in the metro rose 2.2 percent to reach a new high of 7,430 units. Meanwhile, pending sales only showed a 0.2 percent gain and new listings fell 0.5 percent. Persistently low inventory levels are keeping some would-be buyers out of the market. The number of homes for sale fell 16.5 percent to 12,464 active listings in the metro. Declining foreclosure and short sale activity can contribute to market-wide declines. For example, within the traditional segment, new listings rose 1.6 percent and pending sales rose 2.4 percent.

Prices are still marching higher. In fact, the median sales price rose 7.0 percent from last year to $259,000—a new record high. Home prices have now risen for the last 64 consecutive months. At 47 days on average, homes went under contract 16.1 percent faster than last June. However, half the homes that went under contract in June took less than 20 days to do so. The average percent of original list price received at sale was 99.5 percent, 0.8 percent higher than June 2016. Similarly, the median percent of original list price received at sale was 100.0 percent, meaning half the sales closed for over list price. The metro area has a sparse 2.5 months of housing supply—the lowest June reading since 2003. Generally, five to six months of supply is considered a balanced market where neither side has a clear advantage.

“The numbers confirm what agents already know about this market,” said Cotty Lowry, Minneapolis Area Association of REALTORS® (MAAR) President, “We are still very thirsty for listings. That means sellers who list well-presented, well-priced homes are being rewarded, and they’re finding the move-up market to be less competitive.”
June-2017-Chart-702x494
A thriving and diverse local economy has been conducive to housing recovery, as job growth is key to new household formations. The most recent national unemployment rate is 4.4 percent, though it’s 3.7 percent locally. The Minneapolis–St. Paul region has a resilient economy with a global reach, a talented workforce, top notch schools and a quality of life that’s enabled one of the highest homeownership rates in the country.

The average 30-year fixed mortgage rate has declined from 4.3 percent to 4.0 percent recently, still well below its long-term average of about 8.0 percent. Excluding any surprising data or events, the Federal Reserve is likely to increase their target federal funds rate at least once more this year. Wage and inventory growth are key to offsetting affordability declines brought on by higher rates and rising prices.

“Although supply is tight, attractive and competitively-priced homes remain in high demand,” said Kath Hammerseng, MAAR President-Elect. “But even as construction activity recovers somewhat, wage and housing supply growth remain key to balancing out affordability concerns.”
From The Skinny Blog.

Recent New Construction Activity by Price Point

By David Arbit on Friday, June 23rd, 2017

As the shortage of residential property listings persists, many observers are rightly examining recent new construction trends. We’d like to get in on that.
INV-1-702x511
Using exclusively NorthstarMLS data, this analysis only looks at listings with a “year built” field of 2016 or later. However, the closed sales count only uses 2017YTD activity and inventory is always the most recent monthly snapshot, further limiting the pool of records and keeping the analysis as up-to-date as possible while still allowing for a reasonable sample size of records.

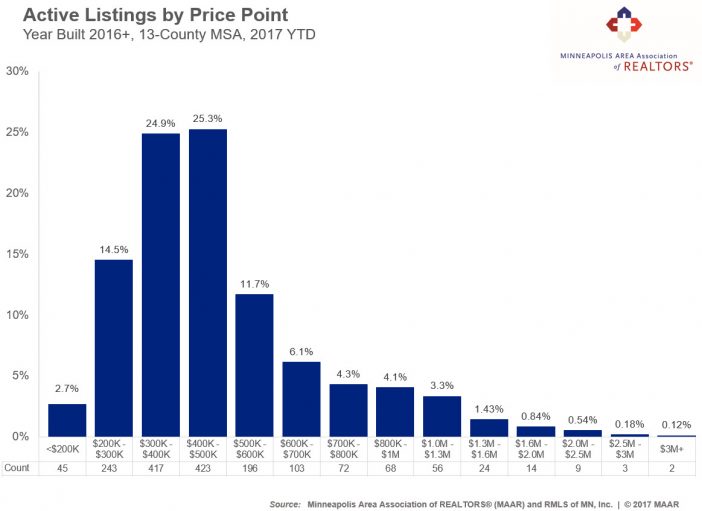
As of the end of May 2017, 25.3% of all active listings that were built in or after 2016 were listed between $400,000 and $500,000. 24.9% of all actives were listed between $300,000 and $400,000. In other words, about half of all recently-built active listings were priced between $300,000 and $500,000. About 33% were priced above $500,000; while the remaining 17% were listed under $300,000.

There are a few noteworthy trends here. There seem to be several threshold effects. First, active listing market share declines dramatically above $500,000 for relatively recent construction and then flattens out somewhat. The next notable decline comes above the $1.3M mark. That may reflect the tear-down activity happening around the metro–particularly within the urban cores and inner-ring suburbs. Even though most of the demand for new construction is well under $1M (more on that below), this could reflect the higher land, tear-down and (re)development costs associated with infill construction. There is also a significant decline above $2.5M, which could reflect a mix of risk aversion from developers and a fairly limited buyer pool.
CS-1-702x514
Transitioning over to the demand side, the $300,000 to $400,000 bracket witnessed the largest share of newly-built home sales. Next up was the $400,000 to $500,000 range, followed by the $200,000 to $300,000 range. Once again, activity drops off above $500,000 and again over $600,000.

Interestingly, and in contrast to active listing share, the $800,000 to $1,000,000 range enjoyed more sales than the $700,000 to $800,000 range. Sales between $1,300,000 and $1,600,000 represented less than half the market share of those between $1,000,000 and $1,300,000. In other words, the “$1,000,000 plus crowd” may be willing to enter the low seven-figures but maybe not yet much beyond that.

The $800,000 to $1,000,000 range also captures listings that sellers and builders initially listed at $1,049,000 or $1,099,000 and had a price adjustment or an offer accepted under the $1,000,000 threshold. Even though a home may have been listed above the $1,000,000 mark, it may have sold for less.
Ratio-1-702x515
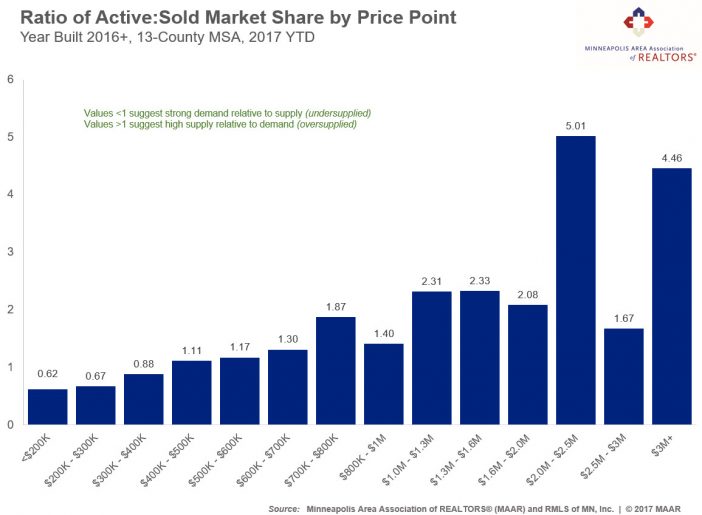
That got us thinking: wouldn’t it be cool to look at the ratio of active versus sold market share by price point? Of course it would! So that’s what we did.

Unsurprisingly, for the most part, active market share tends to outweigh sold market share as you climb the price ladder. In other words, the higher the price point, the more likely you are to have more supply relative to demand. That’s why absorption rates and market times increase in the higher brackets. It’s also why the ratio of sold price to list price tends to be slightly lower. There simply isn’t the same market pressure or imbalance between supply and demand in the luxury brackets as there is in the affordable brackets.

As indicated, that theory is mostly supported by this analysis, with a few exceptions. First, the market share of active listings between $2,000,000 and $2,500,000 is about 5 times that of the sold market share in that range (0.54% versus 0.11%). Even though it’s a small sliver of both active and sold market share, it’s that ratio or relationship between the two shares that we’re after. Even the $3,000,000 and up range has a ratio of about 4.5.

Second, and perhaps surprisingly, the ratio of active to sold market share in the $2,500,000 to $3,000,000 range was only about 1.7, lower than all other ranges above $700,000 except $800,000 to $1,000,000. That means the active market share in that range is only about 60-70 percent higher than the sold market share in that range, which seems downright balanced compared to 4 to 5 times greater active versus sold market share in other upper brackets.

Third, and as expected, it’s difficult for builders to be profitable under the $300,000 price point, given rising construction costs, limited lot availability, the labor shortage and new impact fees. Also as expected, budget-conscious consumers facing limited inventory options are having to go farther out where newer construction is more common. The fact that sold market share is outpacing active market share in all ranges up to $400,000 speaks to the strong demand but insufficient building activity in these affordable and in-demand price points.

You see? Data can be educational AND fun! Infosparks and the many market reports on our website can help you impress your next client and increase your referrals and repeat business. Please use the data for good and never for evil!
From The Skinny Blog.

Inventory Low, Market Times Quick, Buyer and Seller Activity Steady

By David Arbit on Thursday, June 15th, 2017

Compared to May 2016, new listings in the Twin Cities inched up 0.7 percent while closed sales fell 1.1 percent. Given that there were 17.3 percent fewer homes on the market compared to last May, it’s clear that buyers remain motivated. Declining foreclosure and short sale activity can contribute to market-wide declines. For example, traditional new listings rose 2.5 percent while traditional closed sales rose 2.1 percent. Those shopping for homes have 11,615 properties from which to choose in the metro area, the highest figure so far this year but the lowest May inventory reading since 2003.

Prices continued to rise. The median sales price rose 5.5 percent from last year to $250,000. Nominal home prices have now risen for the last 63 consecutive months. Multiple offers on updated, turn-key properties are common in low inventory environments. Properties also tend to sell quickly and for close to or above list price. Homes went under contract 15.0 percent faster than last May. Half the homes on the market sold in less than 20 days. The average percent of original list price received at sale was 99.5 percent, 0.9 percent higher than last year. Similarly, the median percent of original list price received at sale was 100.0 percent, meaning half the sales closed for over list price. The metro area has just 2.3 months of housing supply—the lowest May reading since 2003. Generally, five to six months of supply is considered a balanced market where neither buyers nor sellers have a clear advantage.

“Not only does the traditional market now account for over 96.0 percent of sales,” said Cotty Lowry, Minneapolis Area Association of REALTORS® (MAAR) President, “but traditional new listings and sales continue to rise, despite the shortage of homes on the market.”
Market-Activity-PR-May-702x497
A thriving and diverse local economy has been conducive to housing recovery, as job growth is key to new household formations. The most recent national unemployment rate is 4.3 percent, though it’s 3.3 percent locally. The Minneapolis–St. Paul region has a resilient economy with a global reach, a talented workforce, top notch schools and a quality of life that’s enabled one of the highest homeownership rates in the country.

The average 30-year fixed mortgage rate has declined from 4.3 percent to 3.9 percent recently, still well below its long-term average of about 8.0 percent. Excluding any surprising data or events, the Federal Reserve is likely to increase their target federal funds rate at least once more this year. Wage and inventory growth are key to offsetting affordability declines brought on by higher rates and rising prices.

“It’s tempting to treat this market as one entity,” said Kath Hammerseng, MAAR President-Elect. “However, that won’t provide an accurate and detailed picture of what’s really happening. Different areas, market segments and price points all behave quite differently.”
From The Skinny Blog.

IMPRESSIVE BUYER ACTIVITY, CONSIDERING THE DRAMATIC LISTING SHORTAGE

By Erin Milburn on Friday, May 12th, 2017

Compared to April 2016, new listings in the Twin Cities declined 8.3 percent while pending sales decreased 8.5 percent. Given that there were about 20.0 percent fewer homes for sale, a modest decrease in signed purchase agreements compared to last year reflects a shortage of listings and not necessarily declining demand. Days on market is still down and the number of showings per listing rose compared to last April. Buyers are still eager to purchase a home, but supply side constraints are weighing on sales activity. Those shopping for homes have 10,916 properties from which to choose in the metro area, the lowest April reading since 2003.

Low supply and high demand environments tend to drive prices higher. The median sales price rose 6.3 percent from last April to $245,500. Multiple offers on updated, turn-key properties are common in low inventory environments. Properties also tend to sell quickly and for close to or above list price. Average days on market until sale fell 20.5 percent to 58 days compared to 73 in April 2016. It’s worth noting that the median days on market for April was a brisk 21 days—a 10-year record pace. The average percent of original list price received at sale was 99.2 percent, 1.2 percent higher than last year. Similarly, the median percent of original list price received at sale was 100.0 percent, meaning half the sales closed for less than full list price while the other half closed for over list price. The Twin Cities has only 2.2 months of housing supply—the lowest April reading since 2003. Generally, five to six months of supply is considered a balanced market where neither buyers nor sellers have a clear advantage.

“Any agent or house hunter can confirm that buyers are in no way disappearing,” said Cotty Lowry, Minneapolis Area Association of REALTORS® (MAAR) President. “But we are seeing signs that the shortage of listings is starting to hold back our demand indicators such as pending [sales] and closed sales. Despite fewer listings, we still saw more showings per listing.”

A healthy and diverse local economy has been conducive to housing recovery. The most recent national unemployment rate is 4.4 percent, though it’s 3.8 percent locally. The Minneapolis–St. Paul region has a resilient economy with a global reach, a talented workforce, top notch schools and a quality of life that’s enabled one of the highest homeownership rates in the country.

The average 30-year fixed mortgage rate has declined from 4.3 percent to 4.0 percent lately, still well below a long-term average of about 8.0 percent. Excluding any surprising data or events, the Federal Reserve is likely to increase their target federal funds rate at least once more this year. Wage and inventory growth are key to offsetting affordability declines brought on by higher rates.

“The shortage of supply in our market is showing up in several ways beyond price gains, quick markets times and multiple offers,” said Kath Hammerseng, MAAR President-Elect. “Additional inventory is key to sustaining our housing recovery and is critical to maintaining a healthy and accessible marketplace.”

All information is according to the Minneapolis Area Association of REALTORS® (MAAR) based on data from NorthstarMLS. MAAR is the leading regional advocate and provider of information services and research on the real estate industry for brokers, real estate professionals and the public. MAAR serves the Twin Cities 13-county metro area and western Wisconsin.

From The Skinny Blog.

Trading places? Seller activity up; signed purchase agreements down

By David Arbit on Monday, April 17th, 2017

Seller activity rose 1.3 percent compared to March 2016. The number of signed purchase agreements declined 3.0 percent, though the number of closed sales rose 8.3 percent. Housing demand has outpaced supply, thus continuing the trend of falling active listings. In March, inventory levels fell about 20.0 percent compared to 2016 levels. Those shopping for homes have 10,213 properties from which to choose in the metro area. Given that figure stands near a 15-year low and demand has reached an 11-year high, affordably-priced homes that are listed often fetch full-price offers or better in record time.

These market conditions tend to drive prices higher. The median sales price increased 7.0 percent from last March to $237,500. Multiple offers on attractive, turn-key properties in the most desirable neighborhoods and school districts are common in low inventory environments. Properties also tend to sell quickly and for close to or above list price. Average days on market until sale fell 14.1 percent to 73 days compared to 85 in March 2016. It’s worth noting that the median days on market for March was a brisk 34 days. The average percent of original list price received at sale was 98.1 percent, 1.3 percent higher than last March. Similarly, the median percent of last list price received at sale was 100.0 percent. The Twin Cities has only 2.0 months of housing supply—the lowest March reading since 2003. Generally, five to six months of supply is considered a balanced market where neither buyers nor sellers have a clear advantage.MAAR-March-2017-Stats-News-Release-702x489

“Buyers were still very active during the first quarter,” said Cotty Lowry, Minneapolis Area Association of REALTORS® (MAAR) President. “This is encouraging as households adjust to marginally higher borrowing costs, though it’s likely a lack of listings that’s suppressing even stronger gains.”

A thriving local economy has been conducive to housing recovery. The most recent national unemployment rate is 4.5 percent, though it’s 4.2 percent locally. The Minneapolis–St. Paul region has a diversified and resilient economy with a talented workforce that’s enabled one of the highest homeownership rates in the country.

The average 30-year fixed mortgage rate has declined from 4.3 percent to 4.1 percent lately, still well below a long-term average of about 8.0 percent. Barring any unforeseen events, the Federal Reserve is likely to increase their target federal funds rate at least once more this year. Wage and inventory growth are key to offsetting affordability declines brought on by higher rates.

“We’re still seeking a healthier balance in the marketplace that enables all participants to achieve their goals,” said Kath Hammerseng, MAAR President-Elect. “It’s essential to bring additional options to buyers, particularly in the more affordable price brackets.”

From The Skinny Blog.

Dear sellers, now is your time to shine!

By David Arbit on Monday, March 20th, 2017

With the number of homes available for sale at a 14-year low, the well-priced homes that are on the market are often getting full-price offers or better in record time. Active listings continue to drop, they’re currently down 25.3 percent compared to last February. Those shopping for homes have 8,820 options from which to choose. But not enough sellers are taking advantage of the opportunity to have their listing truly stand out. New listings declined 7.5 percent to 5,418, while buyers signed just slightly more contracts this February compared to last. Pending sales increased 0.5 percent from February 2016. The fact that contract signing hasn’t slowed down despite the supply constraints is testimony to the determination of Twin Cities home buyers. Closed sales, on the other hand, fell 18 units shy of last year’s levels.MAAR-February-2017-Stats-News-Release-702x490

The median sales price increased 7.6 percent from last February to $223,000. Competing bids in the form of multiple offers on attractive properties in the most desirable neighborhoods are common in low inventory environments. Properties also tend to sell quickly and for close to or above list price. Average days on market until sale fell 14.6 percent to 82 days compared to 96 in February 2016. The average percent of original list price received at sale was 96.5 percent, 1.4 percent higher than last February. Given the strong demand and weak supply, our market has only 1.8 months of supply—the second lowest figure on record for any month since January 2003. This indicator measures the balance between supply and demand. Generally, five to six months of supply is considered a balanced market.

“So far 2017 is off to a healthy start, but we need more sellers in order to sustain this recovery,” said Cotty Lowry, Minneapolis Area Association of REALTORS® (MAAR) President. “Diminishing gains on the demand side could already reflect the dramatic supply shortages that today’s home buyers are experiencing. It’s critical to aim for balance—where neither buyers nor sellers have a clear advantage.”

A thriving local economy has been conducive to housing recovery. The most recent national unemployment rate is 4.7 percent, though it’s 3.6 percent locally. The Minneapolis–St. Paul metropolitan area has one of the lowest unemployment rates of any major metro area. Private job growth has also exceeded expectations lately.

The average 30-year fixed mortgage rate stands at 4.17 percent, still well below a long-term average of roughly 8.0 percent. Many observers are expecting the Federal Reserve to increase their target federal funds rate at the March meeting. Barring any unforeseen events or economic data surprises, the Fed is likely to make at least one more rate adjustment in 2017. Job, wage and inventory growth are key to offsetting affordability declines brought on by higher rates.

“The momentum in the market continues to favor sellers and higher prices—though not in every area nor at every price point,” said Kath Hammerseng, MAAR President-Elect. “As we move into the spring market, more buyers will compete for limited inventory, making this environment quite attractive for sellers.”
From The Skinny Blog.