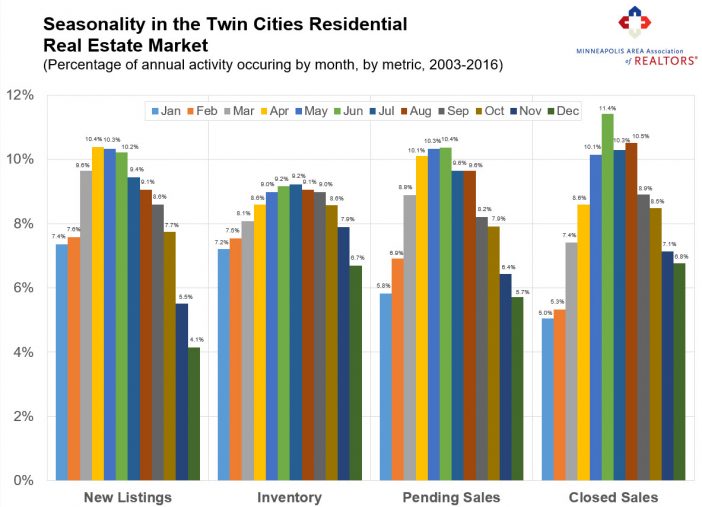
Given the fact that the school year is about a month away (yikes) and we’ve already had our first preview of fall weather, it feels like a good time to talk about seasonality. First of all, whatever you do, don’t use the term “seasonably adjusted.” Second of all, don’t make matters worse by talking about the “seasonably adjusted medium sales price.” That’s not a thing.
All kidding aside, both agents and the public have a vested interested in knowing how and when listings, inventory levels, purchase agreements and closed sales ebb and flow throughout the year. Ever been asked the question or wondered “when do the most new listings come on the market?” Or “when do buyers write the most offers?” Or how about “what month tends to have the greatest number of homes for sale?”
These are legitimate and important questions that can inform a variety of market-related strategies. Technically, April sees the highest volume of new listings, but buyers have the greatest number of choices in July. Signed purchase agreements peak in June along with closed sales. The shape of the seasonal curves can also be revealing. Seller activity tends to ramp up quickly in March and April and then quiet down rapidly starting in October. New listings are front-loaded in the first half of the year. Buyer activity, particularly pending sales, tends to follow more of a “normal” or even distribution throughout the year.

From The Skinny Blog.
