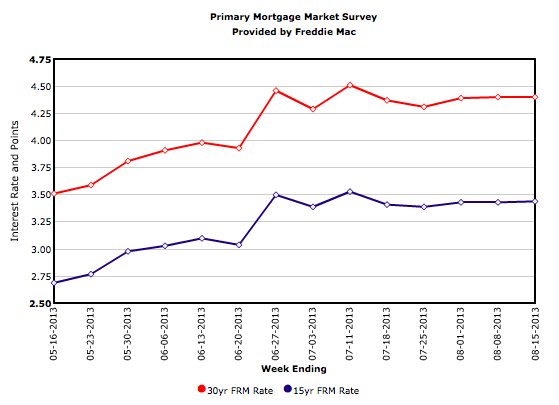
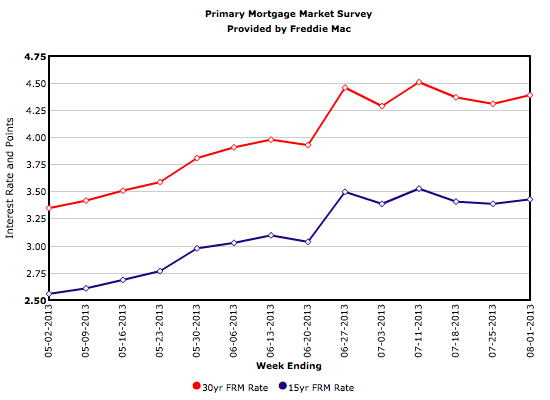
Freddie Mac’s Primary Mortgage Market Survey® (PMMS®) results released on August 15 show average fixed mortgage rates holding steady from the previous week.
Freddie Mac’s Primary Mortgage Market Survey® (PMMS®) results released on August 15 show average fixed mortgage rates holding steady from the previous week.
The overall median sales price was $208,757, up 17.2 percent compared to July 2012. A shift in sales type is driving this price growth. As recently as July 2011, foreclosures and short sales together comprised 45.4 percent of all sales activity. In July 2013, these two distressed segments made up just 20.6 percent of all sales. On the seller side, the percentage of all new listings that were distressed in July fell to 17.9 percent, down from 41.2 percent in July 2011.
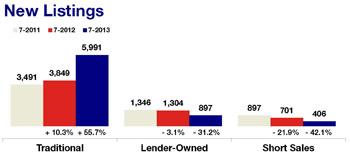
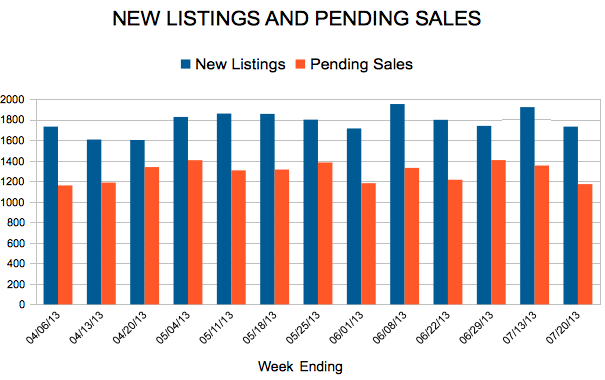
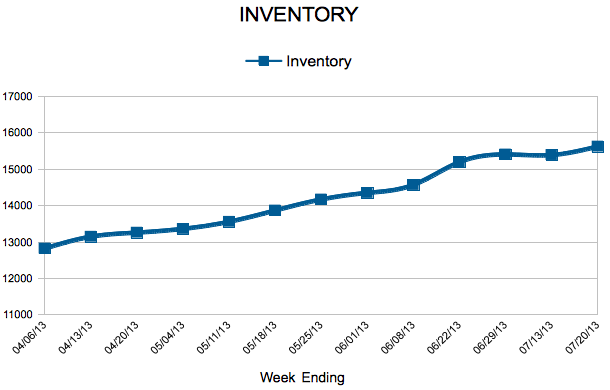
New listings were up 24.6 percent overall, but traditional seller activity surged 55.7 percent – the most in nearly ten years. Foreclosure new listings decreased 31.2 percent and short sale new listings fell 42.1 percent. With 17 straight months of year-over-year median price gains, multiple-offer situations and just 3.6 months’ supply of inventory, the same market that recently favored buyers is now tilting toward sellers. Homes are selling in an average of 72 days – the quickest pace in six and a half years. Sellers are receiving an average of 97.5 percent of their original list price – the highest ratio in just over seven years.
The traditional median sales price rose 3.6 percent to $224,900; the foreclosure median sales price was up 11.6 percent to $135,000; the short sale median sales price increased 18.6 percent to $153,000. On average, traditional homes sold in 62 days for 97.6 percent of original list price, foreclosures sold in 83 days for 98.3 percent of original list price and short sales lagged at 166 days and 93.8 percent of original list price.
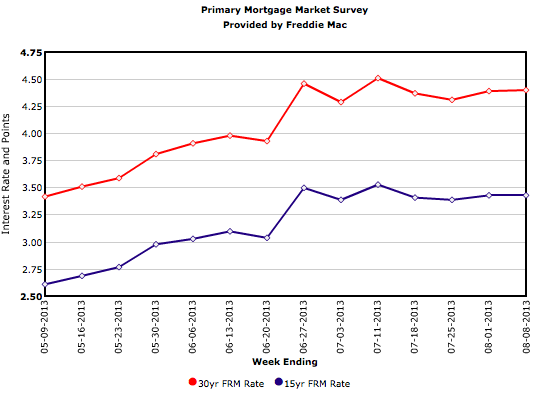
Freddie Mac’s August 8 release of the results of its Primary Mortgage Market Survey® (PMMS®) shows average fixed mortgage rates changing little since last week. Spiking more than a full percentage point since early May, the average 30-year fixed-rate mortgage has seesawed week-to-week, while remaining below its recent high of 4.51 percent in mid-July.
Freddie Mac’s August 1 Primary Mortgage Market Survey® (PMMS®) results show average fixed mortgage rates increasing slightly while still remaining relatively low, helping to support the ongoing housing recovery.

Nationwide, local markets have become stable enough to withstand mortgage rate increases. Improving job and other economic sectors have fortified real, organic housing growth. Bargain-basement deals have given way to multiple offers, stiff bidding wars and lickety-split days on market. Inventory may still be thin, but traditional home sellers are stepping up to the plate with new listings. It won’t be long now until the housing recovery is once again referred to as just housing.
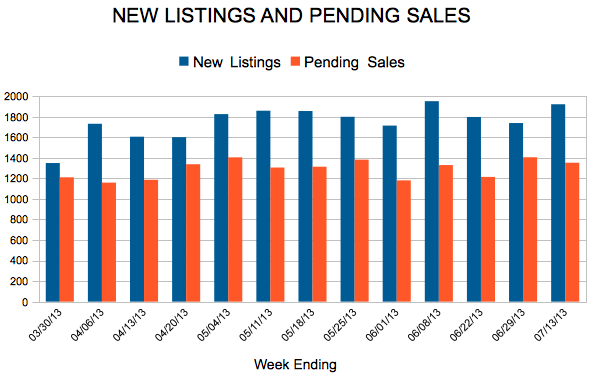
In the Twin Cities region, for the week ending July 20:
For the month of June:
Click here for the full Weekly Market Activity Report.From The Skinny.
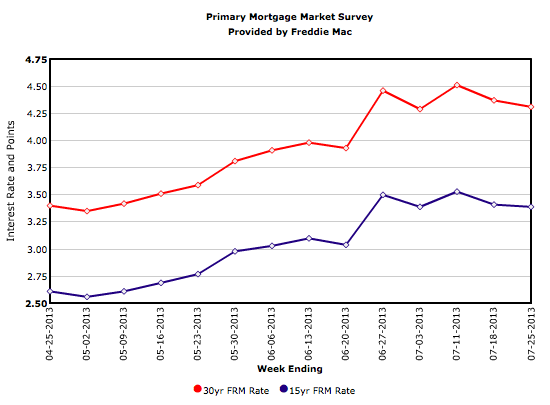
The July 25 release of Freddie Mac’s Primary Mortgage Market Survey® (PMMS®) results shows average fixed mortgage rates easing for the second consecutive week.