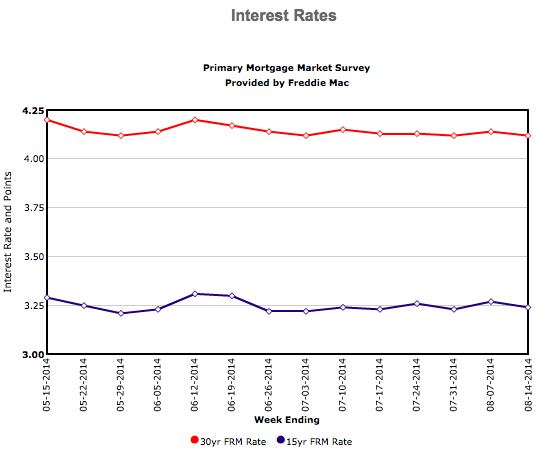
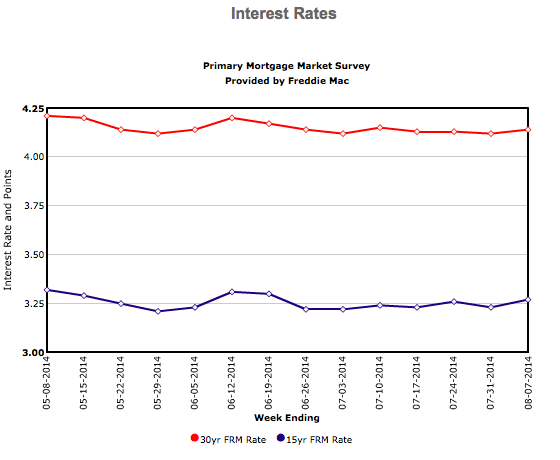
The August 14 release of results of Freddie Mac’s Primary Mortgage Market Survey® (PMMS®) shows average fixed mortgage dipping very slightly as they continue to hover near their 2014 lows.
The August 14 release of results of Freddie Mac’s Primary Mortgage Market Survey® (PMMS®) shows average fixed mortgage dipping very slightly as they continue to hover near their 2014 lows.

The past two years of recovery have defied the initial expectations of many. Some portions of the market are starting to experience a bit of a slowdown, which may be due to seasonal unpredictability, lack of inventory, inability to obtain proper financing under tighter regulations or other factors. As long as good data is available for market analysis, the possibility of continued recovery and stability is present. The slow loris approach to hunting and gathering is not welcome on this journey toward residential real estate expertise.
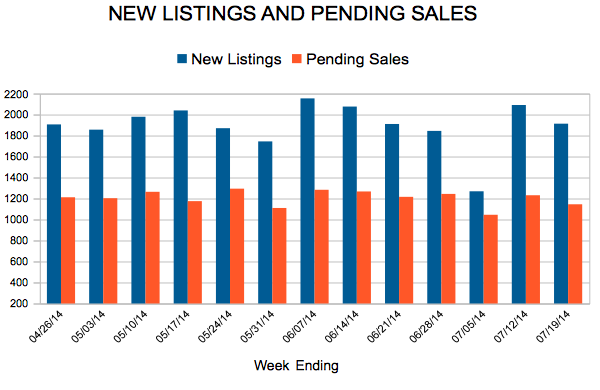
In the Twin Cities region, for the week ending August 2:
For the month of July:
All comparisons are to 2013
Click here for the full Weekly Market Activity Report. From The Skinny Blog.
The release of Freddie Mac’s Primary Mortgage Market Survey® (PMMS®) results on August 7 shows average fixed mortgage rates continuing to make little net movement over the past month and remaining near their lows for the year.
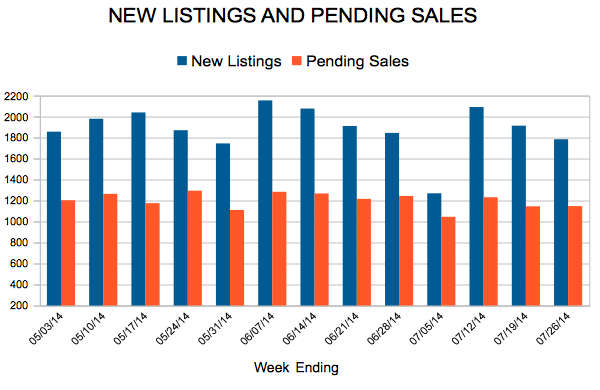
Like a broken digital music player, analysts continue to skip to housing market stability. Although residential real estate activity may not have the same pep as last year’s summer hits, sales are still fancy enough to attract fresh sellers. New listings are up in certain submarkets, which is a needed thing for continued optimism. The highs and lows present a few short years ago are about as visible as a forgotten app, but those days are still just an errant thumb press away.
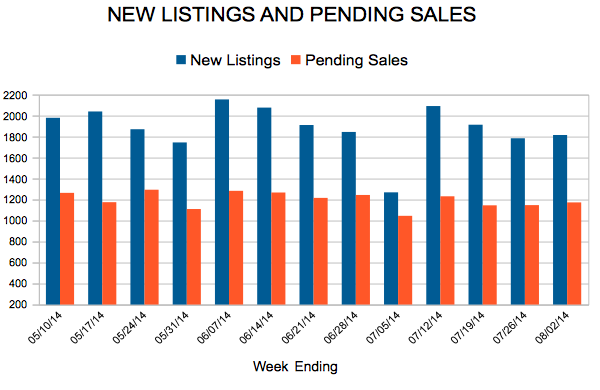
In the Twin Cities region, for the week ending July 26:
For the month of June:
All comparisons are to 2013
Click here for the full Weekly Market Activity Report. From The Skinny Blog.
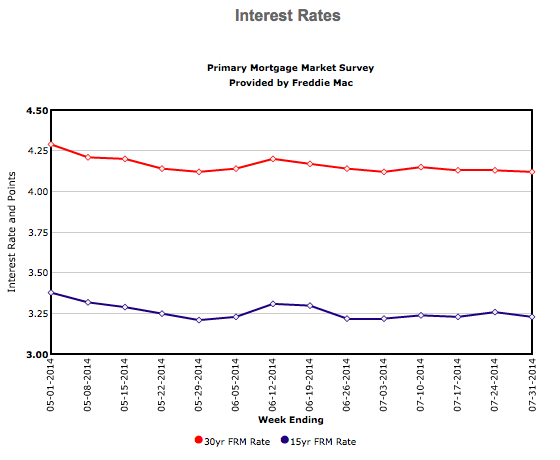
The July 31 release of results of Freddie Mac’s Primary Mortgage Market Survey® (PMMS®) shows average fixed mortgage once again showing very little change while remaining near their 2014 lows.