By David Arbit on Monday, July 20th, 2015
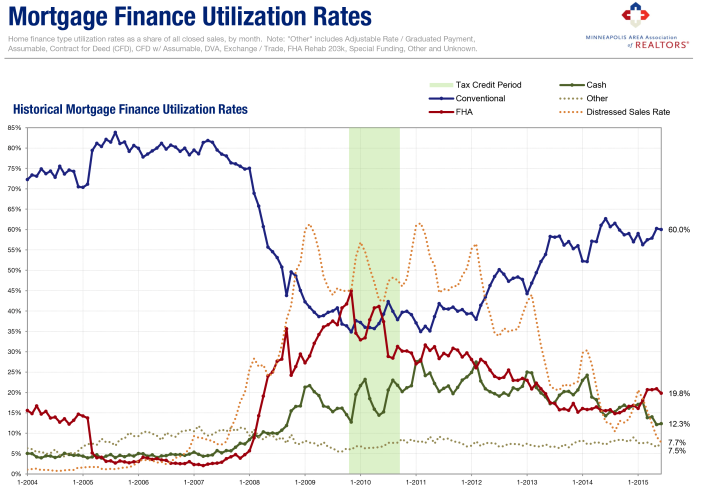 The changing popularity of various home financing tools tells a unique story and shows how the government and private sector mortgage market shares have evolved through the housing crisis and subsequent recovery.
Following the ebbs and flows of the housing market itself, the mortgage finance marketplace has also transformed over the last decade. First, some scene setting. Each trendline above represents the percentage of closed sales in the Twin Cities 13-County MSA that utilized a particular form of mortgage financing, by month. No seasonal adjustments have been performed; the data is raw and comes directly from NorthstarMLS.
Between 2005 and mid-2007, conventional loans made up about 80.0 percent of all mortgages. With conventional mortgage liquidity—shall we say—plentiful, the government only represented about 5.0 percent of loans. As the economy and housing market began to unravel in 2007, the mortgage spigot was drying up. As such, the FHA started to take up that slack and became a dominant player in the mortgage marketplace. By the time of the first-time home buyer tax credit in late-2009, FHA loans comprised a whopping 45.0 percent of sales while conventional loans made up about 35.0 percent of sales. The remaining 20.0 percent include all-cash deals and other loan products.
Though its overall effectiveness remains somewhat debatable, that tax credit signaled a turning point—at least in the mortgage market. At that moment in late-2009, conventional loan market share began to recover and FHA market share started to shrink. Fast forward to present day and conventional loans now make up 60.0 percent of the market while FHA loans make up just 20.0 percent. Earlier in 2015, FHA loans made up about 15.0 percent of closed sales, which is consistent with 2004 levels. Most recognize this as a positive, as the private sector has once again assumed the majority of the risk associated with residential mortgage lending.
All-cash sales can also be illuminating, shining light in some of the more interesting nooks and crannies. Though not all cash sales reflect investor activity, it’s one of the better indications of investors in the market and can be used as a proxy.
Between 2004 and 2008, cash deals made up about 5.0 percent of all closed sales. By February 2011, about 28.0 percent of Twin Cities homes were purchased with cash—a record high. Note the dashed orange trendline. This was at the same time as distressed (foreclosure and short sale) market share was at its highest. Traditional sales volume had fallen dramatically and investors were picking up foreclosures for $0.30 – $0.70 cents on the dollar.
Of the consumers that could, even they were understandably nervous to make large purchases such as a home. Nowadays, about 12.0 percent of sales are done in cash, the lowest share in seven years, or since the middle of 2008. That reflects a mixture of fewer foreclosures and short sales, rising prices, a rising stock market attracting more capital and low inventory levels frustrating traditional buyers and investors alike.
The market numbers are well and good, but sometimes following the money can tell a unique story. The modes of financing behind the market can signal changes in investor behavior, consumer confidence, bank lending patterns and how those forces interplay with one another.
From The Skinny Blog.