By Erin Milburn on Thursday, August 13th, 2015
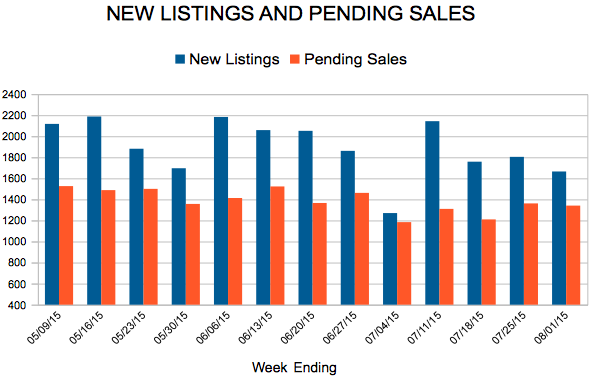
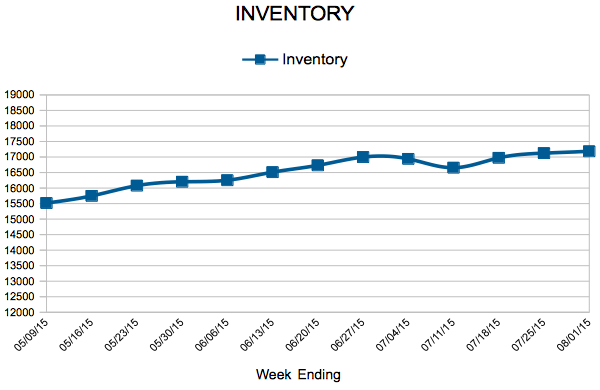
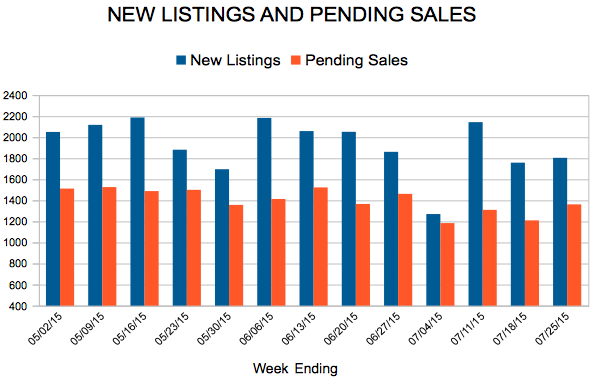
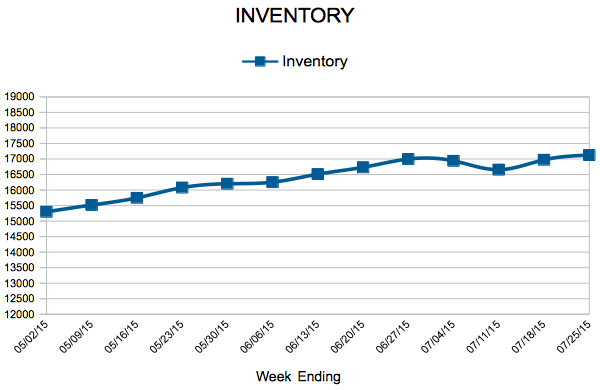
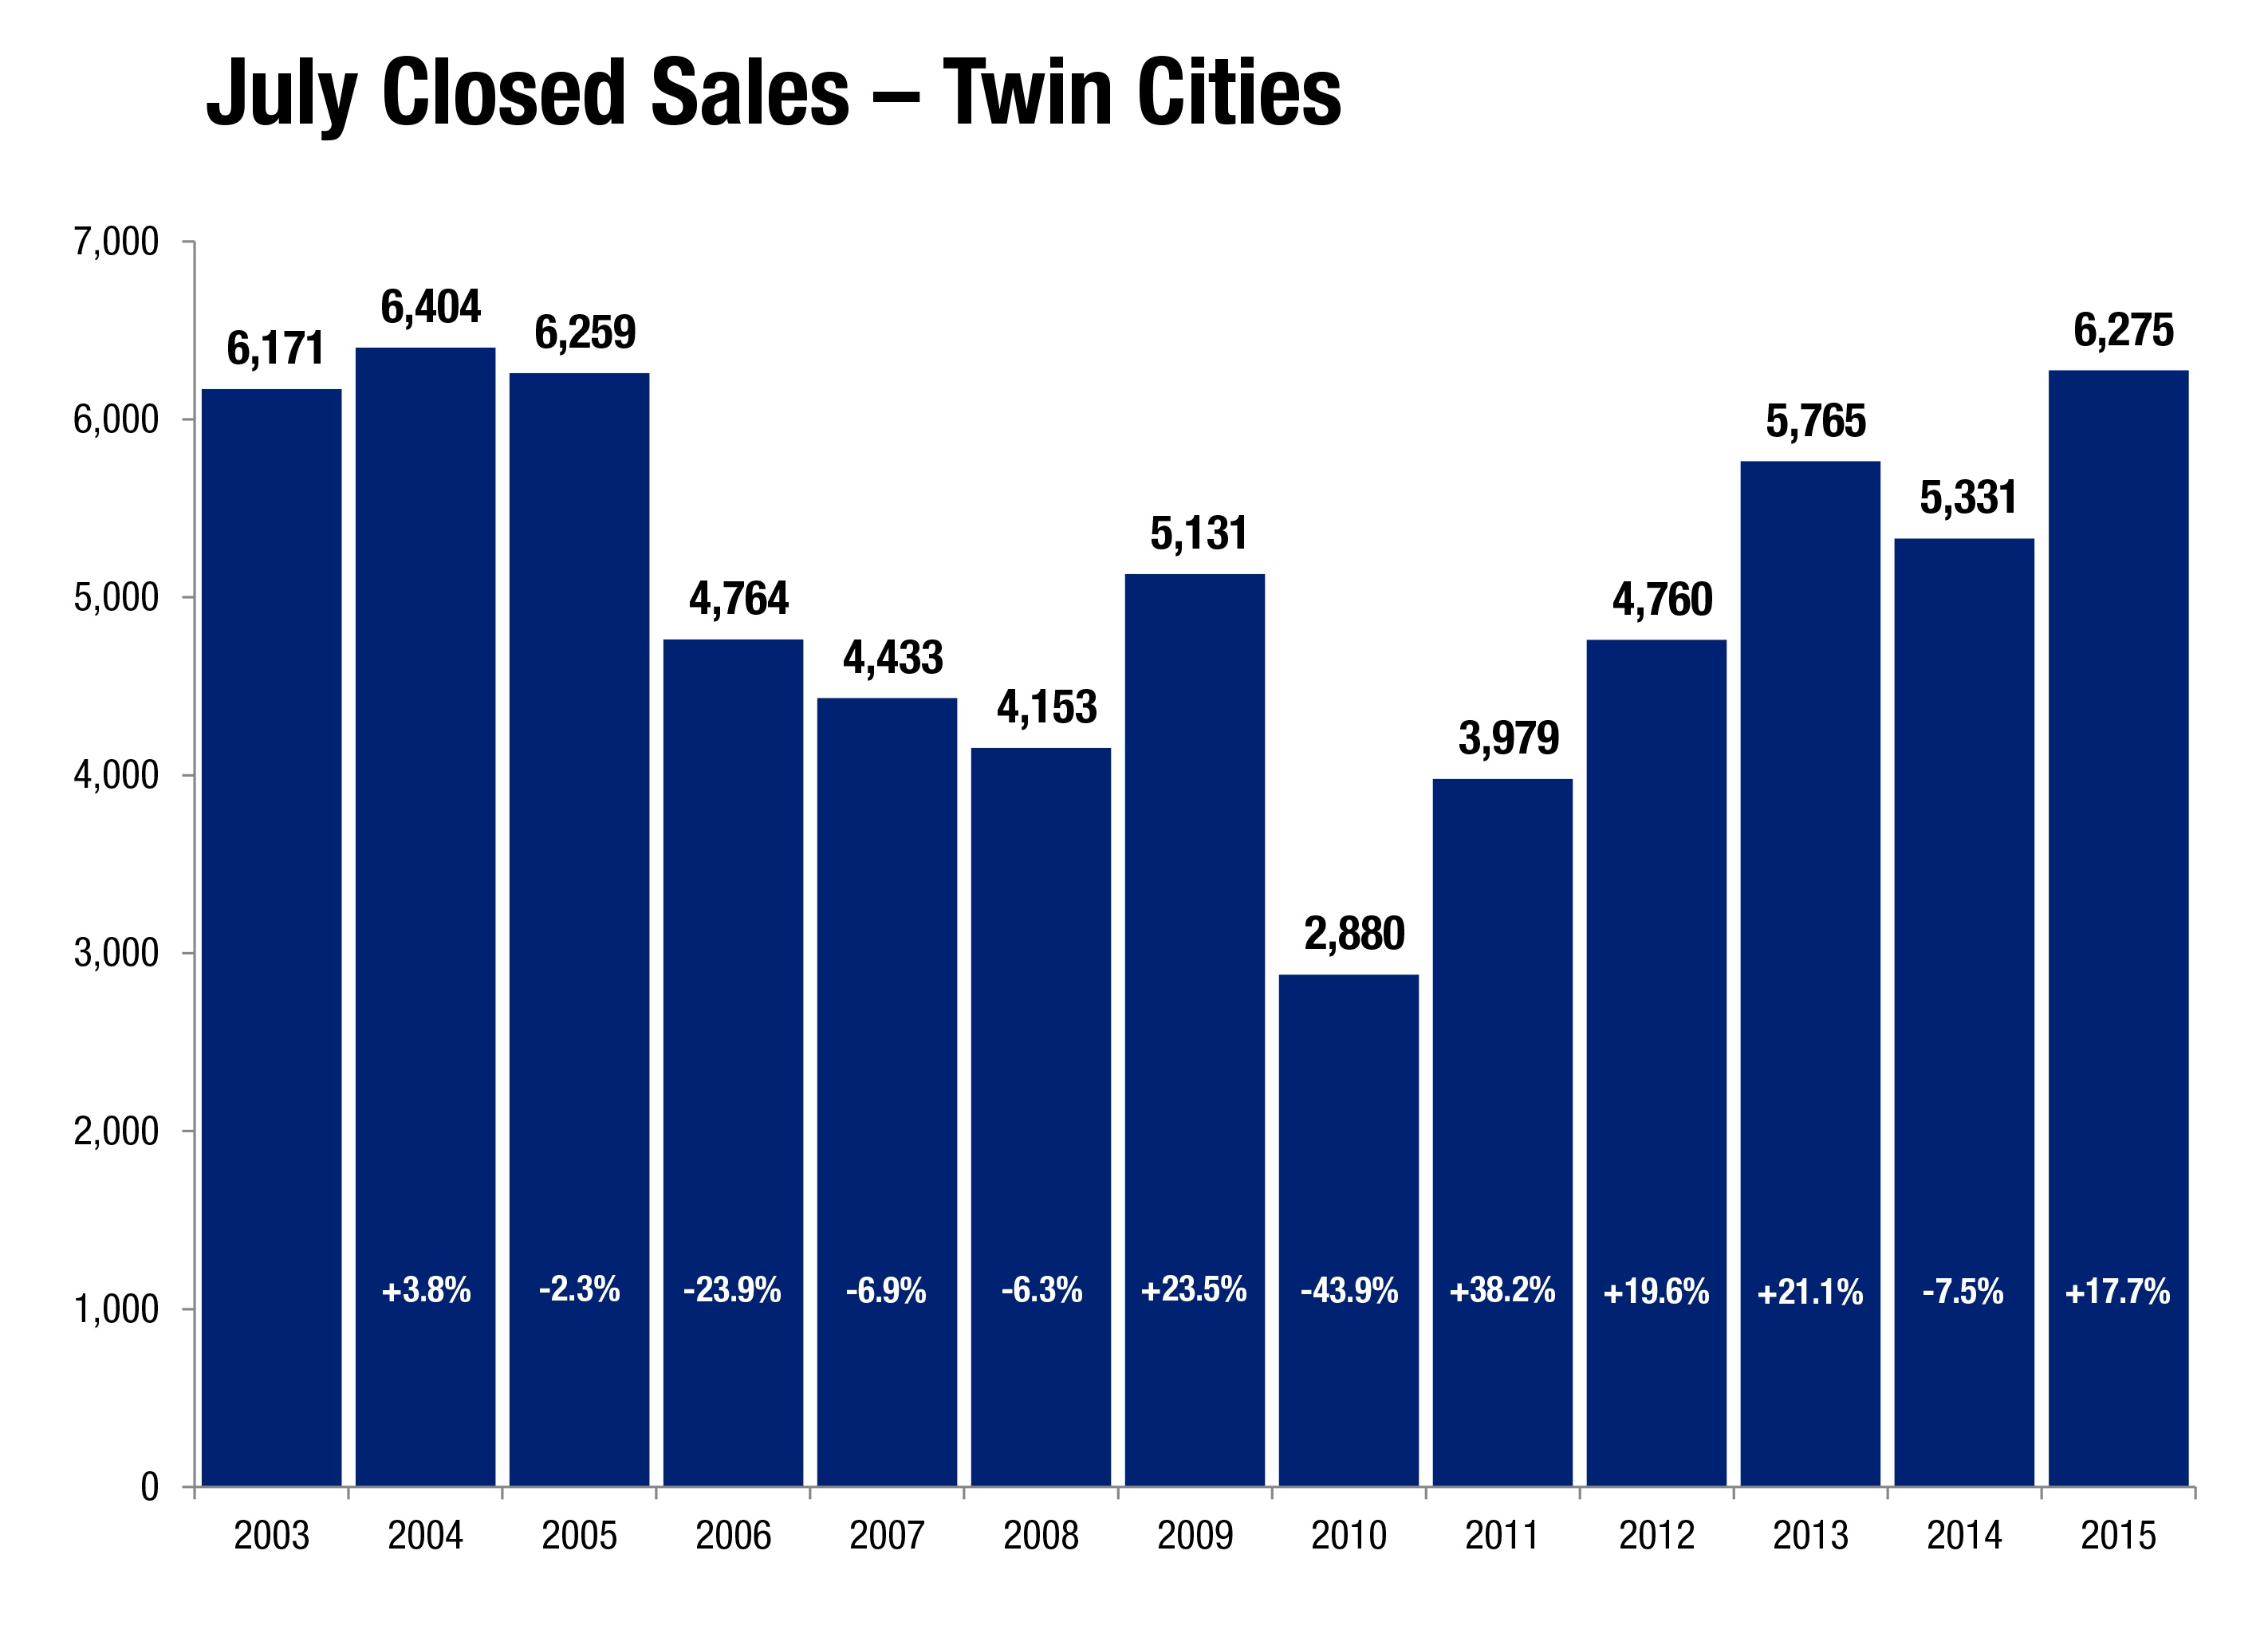
Minneapolis, Minnesota (August 13, 2015) – After purchase demand reached a 10-year record high in June, the Twin Cities metropolitan housing market continued to delight in July. With the spring and summer peak buying season coming to a close, activity levels should begin to cool month-to-month, though most indicators should continue to show year-over-year improvement. The number of signed purchase agreements rose 12.1 percent to 5,716 for July, but are up 18.7 percent so far in 2015. Closed sales increased 17.7 percent to 6,275, but have risen 16.7 percent so far this year. Seller activity was flat compared to last July, new listings fell just 0.4 percent from 7,997 to 7,963. Given that combination of supply and demand movement, the number of available properties for sale fell 11.0 percent to 16,940 homes.
“While those selling their home are yielding top dollar, others wonder if today’s younger generation will be renters forever,” said Mike Hoffman, Minneapolis Area Association of REALTORS® (MAAR) President. “But a National Association of REALTORS® (NAR) survey found that millennials comprised 32.0 percent of all home buyers and 68.0 percent of first-time buyers—both the largest share of any group.”
As interest rates continue to normalize this year, even more pent-up demand from all age brackets will likely be released during this period of historic affordability.
Since demand increased while supply indicators fell—and because a larger share of sales came from the higher-priced traditional segment—the July 2015 median sales price rallied another 4.7 percent to $225,000. The median price per square foot increased 3.4 percent to $120. While the July 2015 median sales price was slightly lower than the June 2015 price, the July 2015 price per square foot was slightly higher than June 2015.
Again due to the factors mentioned above combined with a sense of urgency among buyers, the number of days a property spent on the market fell 7.4 percent to 63 days. Sellers are accepting offers at a median of 98.5 percent of their original list price but 99.7 percent of their final list price, suggesting near-full price offers come quickly once a seller is priced right.
The Twin Cities metropolitan area has 3.7 months’ supply of inventory, which means the region as a whole is a seller’s market. That figure dropped 19.6 percent since July 2014. However, not all local areas, market segments and price points reflect that metropolitan-level reality. This metric is a ratio of supply and demand and indicates how long it would take to completely clear the market assuming no new homes enter the marketplace.
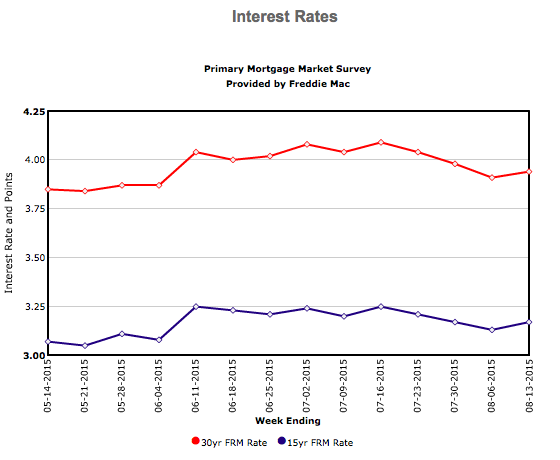
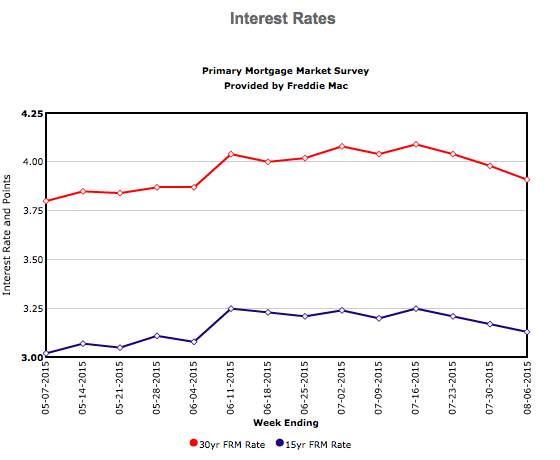
Barring suddenly negative economic data, the Federal Reserve is poised to normalize rates by lifting the Federal Funds rate off of zero starting in September. Mortgage rates are still just below 4.0 percent, compared with a long-term average of over 7.0 percent. Nationally, the economy added 215,000 new private payrolls in July while the unemployment rate held steady at 5.3 percent. The most recent data from the Bureau of Labor Statistics shows the Minneapolis-St. Paul-Bloomington metropolitan area has the third lowest unemployment rate of any major metro.
“We have so many different things going for our region,” said Judy Shields, MAAR President-Elect. “Twin Citizens are smart, and they realize that when rents are high and rising, interest rates are under 4.0 percent and prices are still below their peak, it’s time to consider investing in the stability and predictability of homeownership—in most cases, it’s cheaper than renting.”
From The Skinny Blog.