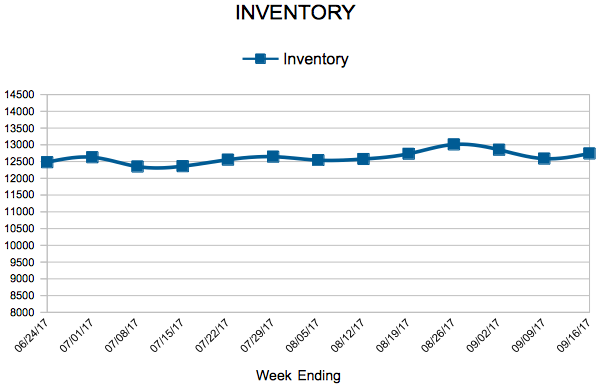
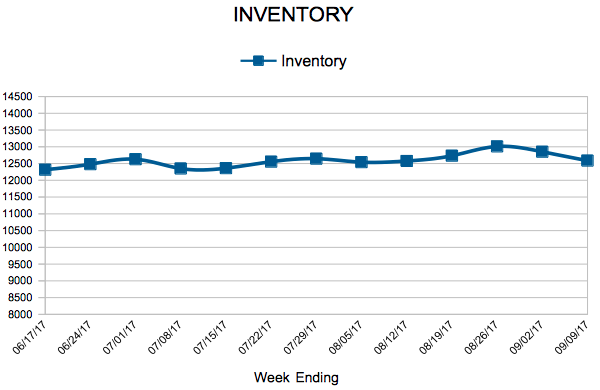
Inventory

For Week Ending September 16, 2017
According to the National Association of Home Builders, there is a rising demand in the new-home market spurred on by ongoing job and economic growth, the continuation of attractive mortgage rates and increased consumer confidence. And there does appear to be a notable increase in building or announced building projects around the country. Builder confidence tends to equate with more construction starts, which would be welcome news in an era of low inventory.
In the Twin Cities region, for the week ending September 16:
For the month of August:
All comparisons are to 2016
Click here for the full Weekly Market Activity Report. From The Skinny Blog.
“The fiercest competition will be on updated turn-key listings close to jobs and amenities.”
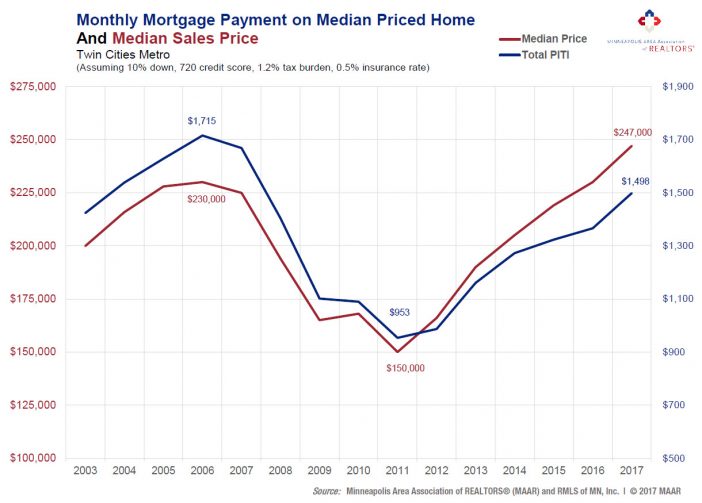
Since home prices for the Twin Cities metro have fully recovered and then some, it’s tempting (and even somewhat logical) to assume that monthly mortgage payments are also at all-time highs. That assumption would be entirely inaccurate. But it makes so much sense! If the median home price is at an all-time high, the monthly mortgage payment on that median priced home must therefore also be at an all-time high. Nope. Still false.
What this assumption fails to account for is of course mortgage or interest rates. The last time prices were this high, in 2006, the 30-year fixed mortgage rate was about 6.5 percent. In 2017, rates are averaging around 4.0 percent. That’s where this all-too-common assumption falls flat on its face.
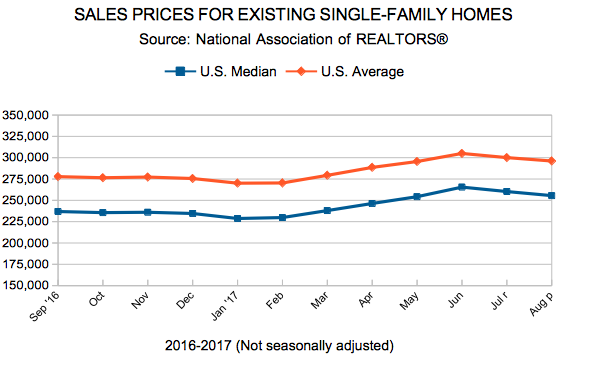
The monthly payment on the median-priced home in 2006 was $1,715, but is only $1,498 in 2017, thanks to rates being 2.5 percentage points lower (6.5 vs 4.0). The median home price, however, has now reached $247,000 compared to $230,000 in 2006. So while affordability has declined since 2012, it still remains above 2004-2007 levels. In other words, despite prices being higher today than in 2006, monthly payments on purchased homes are still below where they were during the housing bubble.
From The Skinny Blog.
Minneapolis, Minnesota (September 18, 2017) – The Twin Cities housing market continues to show signs of high demand and short supply. While June 2017 marked an all-time home sales record for the Twin Cities, closed sales showed a year-over-year decline for the second consecutive month. The number of sellers listing their homes increased slightly, but that wasn’t enough to counteract the inventory drop. New listings increased 0.7 percent from last year to 7,264, and closed sales dipped 1.4 percent. The number of homes for sale decreased 16.7 percent to 12,602. Factoring out foreclosures and short sales, traditional new listings rose 2.4 percent while traditional closed sales increased 0.9 percent.
With many consumers competing for limited homes, prices remained firm, a trend that should continue into the fall and winter months. The median sales price rose 6.8 percent from last year to $252,000—a new monthly record for August. Home prices have now risen for the last 66 consecutive months or 5.5 years. At 48 days on average, homes went under contract 14.3 percent faster than last August. Sellers who do list are averaging 98.5 percent of their original list price, 0.6 percent higher than August 2016. The metro area has just 2.5 months of housing supply. Generally, five to six months of supply is considered a balanced market where neither buyers nor sellers have a clear advantage.
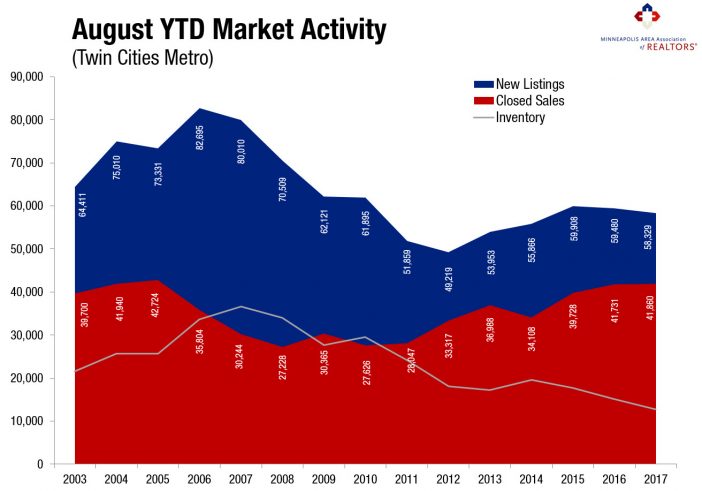
“The shortage of homes for sale is still driving this market,” said Cotty Lowry, Minneapolis Area Association of REALTORS® (MAAR) President. “It’s been the story for years, and it continues to influence prices, sales, market times and other indicators. The graphic illustrates how listings and sales have converged, leaving very little product lingering on the market.”
The shortage is most acute for entry-level homes. Well-priced, turnkey, well-presented listings are most competitive. Market times and absorption rates are tightest for homes priced under $200,000. For example, homes between $150,000 and $190,000 had 1.4 months of supply. As you move up the price ladder, the market is less competitive and better supplied. Homes priced between $500,000 and $1,000,000 boast 6.0 months of supply, while homes over $1,000,000 have a plentiful 12.3 months of supply.
The most recent national unemployment rate is 4.4 percent, though it’s 3.3 percent locally—the fourth lowest unemployment rate of any major metro area. A thriving and diverse economy has been conducive to housing recovery, as job and wage growth are key to new household formations and therefore housing demand. The Minneapolis–St. Paul region has a resilient economy with a global reach, a talented workforce, top-notch schools, exposure to the growing technology and healthcare fields, and a quality of life that’s enabled one of the highest homeownership rates in the country.
The average 30-year fixed mortgage rate has declined from 4.3 percent to 3.8 percent recently, still well below its long-term average of around 8.0 percent. Although at least one more rate hike was expected this year, the Fed is now focused on unwinding its large portfolio. Additional inventory is still needed in order to offset declining affordability brought on by higher prices and interest rates.
“We’re always impressed by how determined buyers are, despite the supply hurdle,” said Kath Hammerseng, MAAR President-Elect. “That said, prices are rising faster than incomes and builders are focusing on higher-end product further out while the demand is strongest for affordable product closer in.”
Questions? Contact David Arbit, MAAR’s Director of Research + Economics | davida@mplsrealtor.com
From The Skinny Blog.
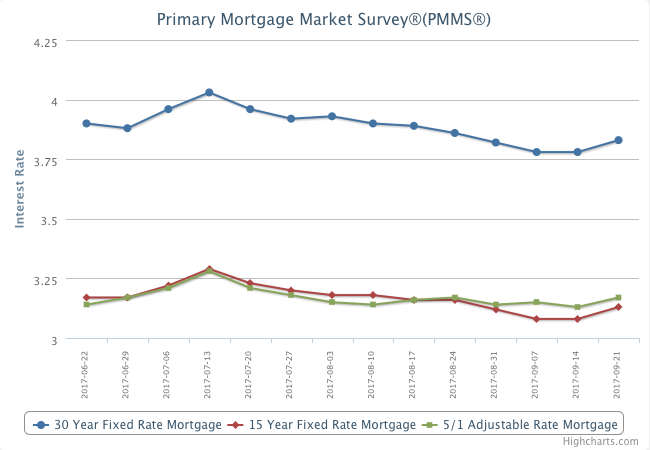
The 10-year Treasury yield continued its upward trend, rising 7 basis points this week. As Freddie Mac expected, the 30-year mortgage rate followed suit, increasing 5 basis points to 3.83 percent. This week’s uptick in the 30-year mortgage rate ends a nearly two-month streak of declines.

For Week Ending September 9, 2017
For several years, residential real estate markets across the country were relatively similar except for a few pockets of extreme price increases in the west and a few areas of slower post-recession recovery in the east. Regional market diversion is becoming more common. Natural disasters play a part, as do factors such as the proclivities and incomes of a younger buyer pool.
In the Twin Cities region, for the week ending September 9:
For the month of August:
All comparisons are to 2016
Click here for the full Weekly Market Activity Report. From The Skinny Blog.