Author Archives: Pat Delaney

Weekly Market Report

For Week Ending April 15, 2017

In light of the low inventory and affordability situation this year, it was a good surprise to see existing home sales hit a national 10-year high. It isn’t a surprise, however, to see multiple offers on a home within a few days of being on the market. Buyer demand is high and will continue to be for the foreseeable future, so it was also welcome news that builder confidence and housing starts were up as well.

In the Twin Cities region, for the week ending April 15:

  • New Listings decreased 17.8% to 1,612
  • Pending Sales decreased 6.7% to 1,374
  • Inventory decreased 20.1% to 10,574

For the month of March:

  • Median Sales Price increased 7.0% to $237,500
  • Days on Market decreased 14.1% to 73
  • Percent of Original List Price Received increased 1.3% to 98.1%
  • Months Supply of Inventory decreased 19.2% to 2.1

All comparisons are to 2016

Click here for the full Weekly Market Activity Report. From The Skinny Blog.

Mortgage Rates Tumble Below 4 Percent

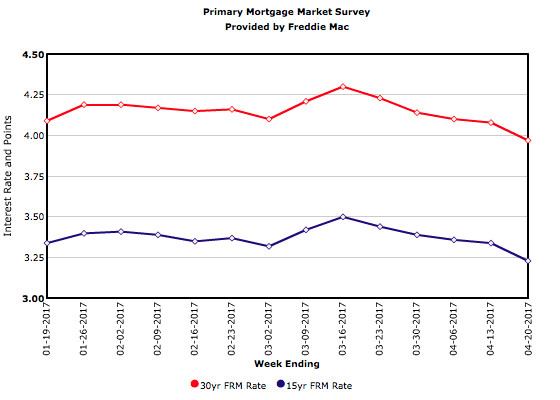
The 30-year mortgage rate fell 11 basis points this week to 3.97 percent, dropping below the psychologically-important 4 percent level for the first time since November. Weak economic data and growing international tensions are driving investors out of riskier sectors and into Treasury securities. This shift in investment sentiment has propelled rates lower.

Trading places? Seller activity up; signed purchase agreements down

By David Arbit on Monday, April 17th, 2017

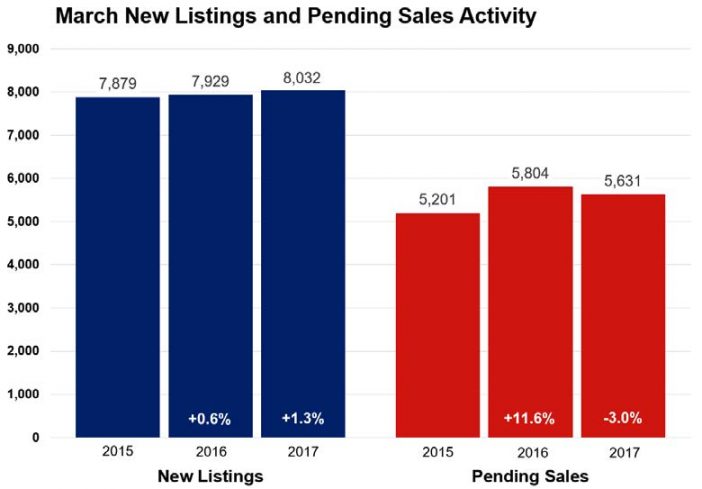
Seller activity rose 1.3 percent compared to March 2016. The number of signed purchase agreements declined 3.0 percent, though the number of closed sales rose 8.3 percent. Housing demand has outpaced supply, thus continuing the trend of falling active listings. In March, inventory levels fell about 20.0 percent compared to 2016 levels. Those shopping for homes have 10,213 properties from which to choose in the metro area. Given that figure stands near a 15-year low and demand has reached an 11-year high, affordably-priced homes that are listed often fetch full-price offers or better in record time.

These market conditions tend to drive prices higher. The median sales price increased 7.0 percent from last March to $237,500. Multiple offers on attractive, turn-key properties in the most desirable neighborhoods and school districts are common in low inventory environments. Properties also tend to sell quickly and for close to or above list price. Average days on market until sale fell 14.1 percent to 73 days compared to 85 in March 2016. It’s worth noting that the median days on market for March was a brisk 34 days. The average percent of original list price received at sale was 98.1 percent, 1.3 percent higher than last March. Similarly, the median percent of last list price received at sale was 100.0 percent. The Twin Cities has only 2.0 months of housing supply—the lowest March reading since 2003. Generally, five to six months of supply is considered a balanced market where neither buyers nor sellers have a clear advantage.MAAR-March-2017-Stats-News-Release-702x489
“Buyers were still very active during the first quarter,” said Cotty Lowry, Minneapolis Area Association of REALTORS® (MAAR) President. “This is encouraging as households adjust to marginally higher borrowing costs, though it’s likely a lack of listings that’s suppressing even stronger gains.”

A thriving local economy has been conducive to housing recovery. The most recent national unemployment rate is 4.5 percent, though it’s 4.2 percent locally. The Minneapolis–St. Paul region has a diversified and resilient economy with a talented workforce that’s enabled one of the highest homeownership rates in the country.

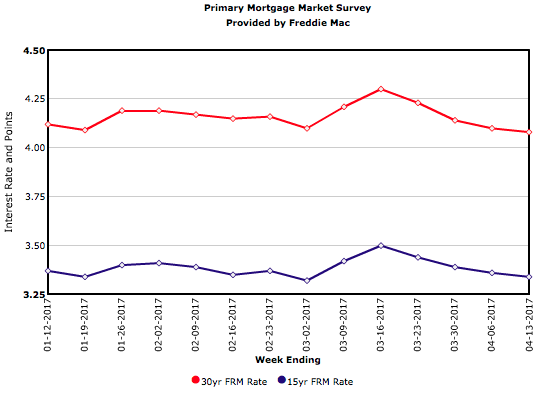
The average 30-year fixed mortgage rate has declined from 4.3 percent to 4.1 percent lately, still well below a long-term average of about 8.0 percent. Barring any unforeseen events, the Federal Reserve is likely to increase their target federal funds rate at least once more this year. Wage and inventory growth are key to offsetting affordability declines brought on by higher rates.

“We’re still seeking a healthier balance in the marketplace that enables all participants to achieve their goals,” said Kath Hammerseng, MAAR President-Elect. “It’s essential to bring additional options to buyers, particularly in the more affordable price brackets.”

From The Skinny Blog.

Weekly Market Report

For Week Ending April 8, 2017

With both inventory and months of supply struggling to keep up with demand, it will not be unusual to see some weeks where pending sales post a year-over-year decline, especially if new listings droop below the standards set during the prior year. Meanwhile, we can continue to expect to see sales prices forge their way upward and affordability shrink downward in what is expected to be a pleasant spring and summer for sellers.

In the Twin Cities region, for the week ending April 8:

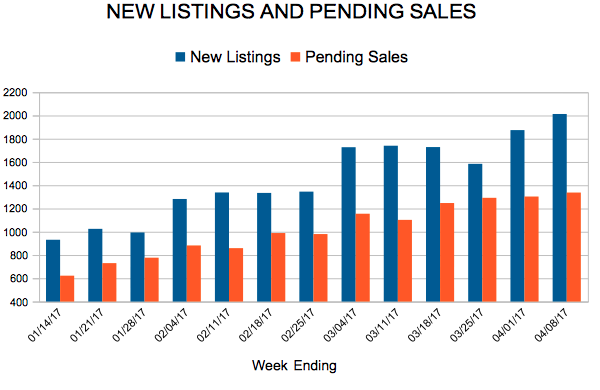
  • New Listings increased 1.4% to 2,013
  • Pending Sales decreased 9.1% to 1,337
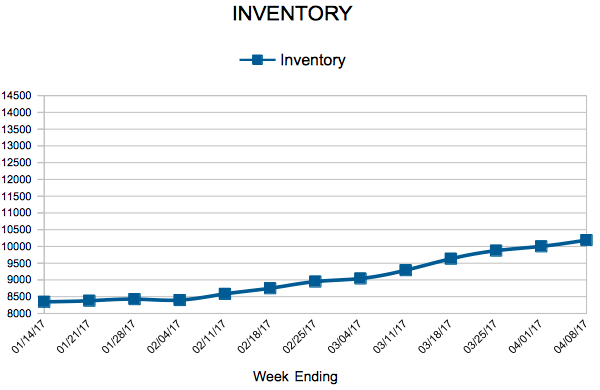
  • Inventory decreased 21.7% to 10,188

For the month of March:

  • Median Sales Price increased 7.0% to $237,500
  • Days on Market decreased 14.1% to 73
  • Percent of Original List Price Received increased 1.3% to 98.1%
  • Months Supply of Inventory decreased 19.2% to 2.1

All comparisons are to 2016

Click here for the full Weekly Market Activity Report. From The Skinny Blog.

Weekly Market Report

For Week Ending April 1, 2017

Confidence in buying a home has fallen according to the Fannie Mae Home Purchase Sentiment Index after hitting an all-time index high in February. Continuing price increases and low inventory are easy answers for why the index fell. The good news is that an improved employment outlook and higher wages are major factors toward purchasing a home, and demand is not expected to abate.

In the Twin Cities region, for the week ending April 1:

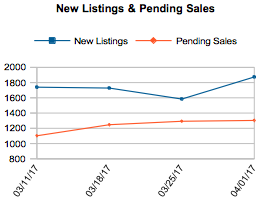
  • New Listings decreased 3.9% to 1,874
  • Pending Sales decreased 5.2% to 1,303
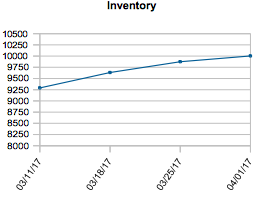
  • Inventory decreased 21.7% to 10,003

For the month of February:

  • Median Sales Price increased 7.7% to $223,250
  • Days on Market decreased 14.6% to 82
  • Percent of Original List Price Received increased 1.4% to 96.5%
  • Months Supply of Inventory decreased 28.0% to 1.8

All comparisons are to 2016

Click here for the full Weekly Market Activity Report. From The Skinny Blog.