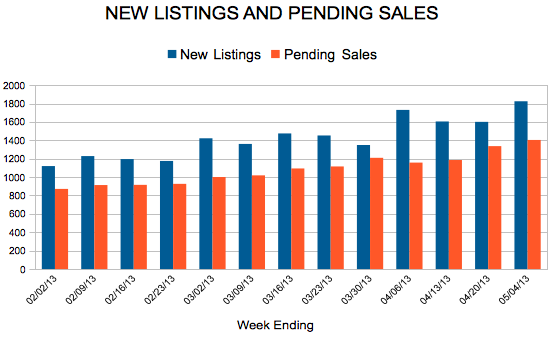
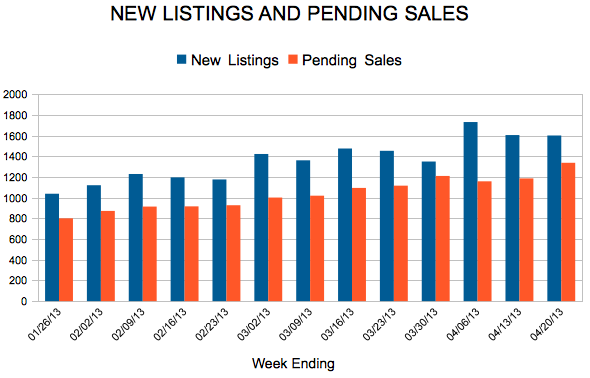
New Listings and Pending Sales

Housing data also encompasses economics, politics, sociology, geography, labor markets and more. Even the largest transaction most people will ever make is susceptible to the same kinds of market forces that affect clothing choices at your favorite department store, the cost of your vacation, public transportation projects and where the next Starbucks is placed (or closed). Be watching the jobs numbers, fuel prices and election results. And keep using the best source of housing data around: your local MLS.
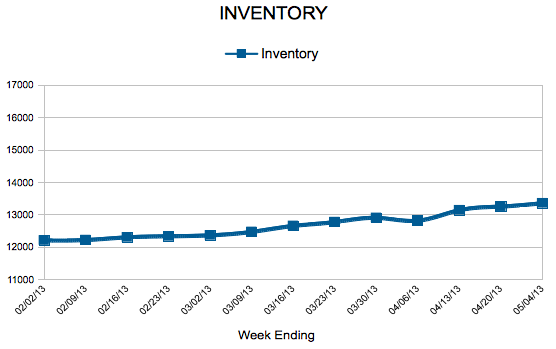
In the Twin Cities region, for the week ending May 4:
For the month of April:
Click here for the full Weekly Market Activity Report.From The Skinny.

This is the highest pending sales count since May 2006. For the same time period, there were 4,138 closed sales, and inventory levels declined 29.3 percent to 13,113 active listings. Driven by the changing mix of sales, solid demand and falling supply, the median home price for the Twin Cities metro rose 12.2 percent to $182,312. The percentage of all new listings that were traditional, non-distressed homes rose to 77.9 percent, its highest level since October 2007. For closed sales, that figure rose to 68.4 percent, its highest level since July 2008.
Seller activity was up 7.7 percent overall, while traditional new listings were up 28.0 percent, foreclosure new listings were down 25.6 percent and short sale new listings were down 39.5 percent. The 10K Housing Value Index – which controls for data variability – showed an 8.5 percent increase to $181,381. With only 3.1 months supply of inventory, more seller participation in the market is important to continued recovery.
The traditional median sales price was up 8.5 percent to $216,000; the foreclosure median sales price was up 11.7 percent to $134,000; the short sale median sales price was up 5.1 percent to $135,000. Traditional sales sold in 90 days; foreclosures sold in 94 days; short sales sold in 178 days, on average.
All information is according to the Minneapolis Area Association of REALTORS® (MAAR) based on data from the Regional Multiple Listing Service of Minnesota, Inc. MAAR is the leading regional advocate and provider of information services and research on the real estate industry for brokers, real estate professionals and the public. MAAR serves the Twin Cities 13-county metro area and western Wisconsin.
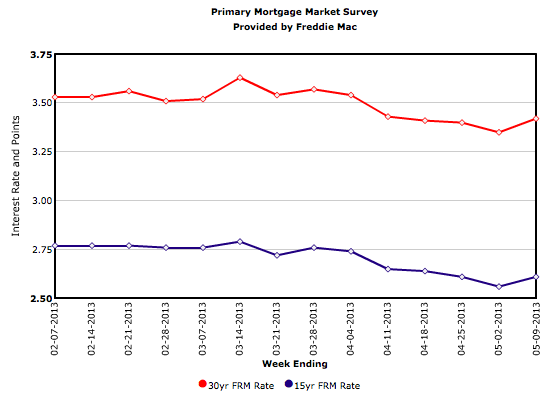
The results of Freddie Mac’s Primary Mortgage Market Survey(R) (PMMS®) released May 9 show average fixed mortgage rates reversing their recent trend and moving higher for the first time in six weeks.
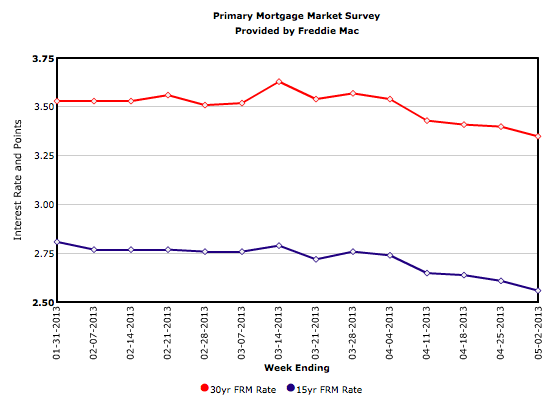
The May 2 release of Freddie Mac’s Primary Mortgage Market Survey® (PMMS®) results shows average fixed mortgage rates moving lower for the fifth consecutive week. The 30-year fixed-rate mortgage at 3.35 percent is just above its all-time record low of 3.31 percent set the week of November 21, 2012. The 15-year fixed-rate mortgage set a new all-time record low at 2.56 percent.

Less supply, more demand and rising prices are being seen in residential markets across the nation. Although grumpy cats using national data sometimes grouse about the housing recovery’s fragility, housing trends have remained positive for well over a year now, and the road ahead looks bright with better lending standards in place. Ominous headlines may benefit advertisers and search engine optimization, but local consumers informed of local situations are in a better position to leverage the market.
In the Twin Cities region, for the week ending April 20:
For the month of March:
Click here for the full Weekly Market Activity Report.From The Skinny.