Category Archives: The Skinny

The Great Mean Reversion

By David Arbit on Tuesday, February 28th, 2017
4-pct-annual-growth-702x479© MAAR 2017 | All rights reserved.

We have all heard the saying “everything eventually reverts to the mean.” No? Fair enough. There’s a saying that goes “everything eventually reverts to the mean.” It’s a way of expressing that, over a sufficient time period, a data set can only remain above or below its long-term trend for so long, but eventually should come back in line with historical averages or growth rates. Applied to our industry, home prices could only stay above trend for so long. Alas, the gravitational pull of market forces is a powerful and unrelenting wonder (with mostly measurable and rational underpinnings).

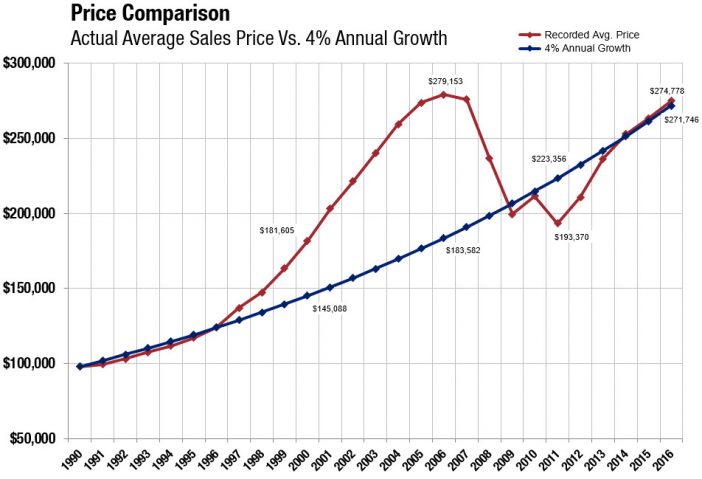
Take, for example, the graphic above which plots reported average home prices alongside 4.0 percent steady annual growth per year. Both trendlines start at the same point–the reported averages sales price in 1990. After the early 1990s ran slightly below trend, 1997-2008 way above trend, 2009-2013 well below trend and 2014-2016 slightly above trend, we are right back in line with where the 4.0 percent growth trend is. This is why some economists use a pendulum analogy when discussing market forces. Markets tend to over-swing “balance” or “equilibrium.” With so much momentum, they tend to move from one extreme to another, without stopping in the middle. We tend to lurch from buyer’s markets to seller’s markets to buyer’s markets and now back to a seller’s market.

Huh. Funny how that works. All the fuss, all the lost equity, all the subsequent appreciation, all those foreclosures, all the boom-bust cycles, all those debates about over or under-regulated wall street banks and mortgage markets and whether housing can go higher still and if incomes can keep up. And for what?

Home prices ended up more or less where they belong. We’ve reverted right back to our historical growth trend. The market is back where it should be had housing appreciated at a steady 4.0 percent per year.

It’s not just housing, commodity and capital markets that gravitate back to their long-term trajectories. Sea turtles, sockeye salmon and other members of the animal kingdom also understand the instinctual pull of home. No matter how far they roam, they travel vast distances to return to their original habitat–the environment that gives them a sense of familiarity and balance.

From The Skinny Blog.

Housing on a Healthy, Balanced Diet, but Hungry for New Supply

By David Arbit on Thursday, February 16th, 2017

Right around the time when second-hand shops receive an influx of donated exercise equipment, we get our first glimpse of the year at our local housing market. Overall, it was a healthy and balanced start to the new year. New listings rose 3.1 percent to 4,304—the second strongest gain in nearly a year. Pending sales increased 4.3 percent compared to last January. Given the rush to lock in interest rates and close deals before the end of 2016, closed sales lagged slightly.

When it comes to inventory, the market is still feeling deprived. There were only 8,212 for-sale properties last month, 25.4 percent fewer than last January. That officially marks a 14-year record low for inventory. The median sales price increased 4.7 percent from last year to $225,000. Additional supply is a missing piece of this recovery and is critically needed. Competing bids on the most attractive properties are common in low inventory environments, and homes tend to sell quickly for close to or above list price. Average days on market until sale fell 7.1 percent to 79 days compared to 85 in January 2016. The average percent of original list price received at sale was 95.9 percent, 0.9 percent higher than last January. But the median days on market fell to 53 days and the median percent of current list price received increased to 98.9 percent. Given strong demand of late, the marketplace has only 1.6 months of supply—the lowest figure on record for any month since January 2003. This indicator measures the balance between supply and demand. Generally, five to six months of supply is considered a balanced market.

January-News-Release

“Both buyers and sellers were feeling confident compared to January 2016,” said Cotty Lowry, Minneapolis Area Association of REALTORS® (MAAR) President. “It is obviously still early in the year, but that increase in new listings was the second strongest gain in about a year. If that is sustained, we should be able to achieve the balancing act of steady price gains while maintaining our affordability.”

Though single family sales dominate the Twin Cities market by number, townhome sales showed the largest year-over-year sales increase followed by condos. Similarly, though previously-owned properties make up the largest share of sales, new construction properties had a much larger year-over-year sales increase. The most active price range over the last 12 months is $190,000 to $250,000 but the largest gain in sales occurred in the $350,000 to $500,000 range.

A thriving local economy has been conducive to housing recovery. The most recent national unemployment rate is 4.7 percent, though it’s 3.6 percent locally. The Minneapolis–St. Paul metropolitan area has one of the lowest unemployment rates of any major metro area.

The average 30-year fixed mortgage rate stands at 4.17 percent, still well below a long-term average of about 8.0 percent. Marginally higher rates were widely expected in 2016, but the Federal Reserve waited until December. Expect about two minor increases in the federal funds rate in 2017—barring any unforeseen events. Job, wage and inventory growth are key to offsetting any declining affordability brought on by higher rates.

“The trick will be increasing supply enough to keep price growth at a moderate pace,” said Kath Hammerseng, MAAR President-Elect. “That will allow households to better absorb rising borrowing costs. Overall 2017 is expected to be another good year for housing.”

From The Skinny Blog.

2016 Annual Wrap-Up: Home Prices Reach Record High and Home Sales Reach 11-year High

By Erin Milburn on Tuesday, January 17th, 2017

The big story of 2016 was twofold: the median sales price reached an all-time high; while closed sales reached an 11-year high. Closed sales nearly broke their all-time record, but fell 0.3 percent short of their all-time 2004 high. Seller activity declined 1.1 percent. Near-record sales activity combined with flat-to-weaker seller activity created a supply shortage. Active housing supply levels fell to a 14-year low. This shortage has created a competitive environment where multiple offers have become more common. Sellers are receiving strong offers in record time, but this fast-paced market can frustrate some consumers. Days on market fell to a 10-year low. Absorption rates fell to 1.6 months of supply at year-end, a record low. Foreclosure activity fell for a fifth straight year and is back below 2007 levels. Although single-family homes made up about 75.0 percent of all sales, both townhomes and condos showed a stronger increase in sales. Similarly, previously-owned homes made up about 93.0 percent of sales but new construction showed a much stronger increase.

2016 by the Numbers

Sellers listed 76,531 properties on the market, a 1.1 percent decrease from 2015
Buyers closed on 59,988 homes, a 6.2 percent increase from 2015 and the highest figure since 2005
Inventory levels for December fell 26.3 percent to 8,197 units compared to 11,125 in 2015—a 14-year low
Months Supply of Inventory was down 30.4 percent to 1.6 months, also a 14-year low
The Median Sales Price rose 5.5 percent to $232,000, which is an all-time record high
Cumulative Days on Market declined 15.8 percent to 64 days, on average (median of 33)—a 10-year record low
Changes in sales activity varied dramatically by market segment

  • Single-family sales rose 5.1 percent; condo sales rose 9.5 percent; townhome sales rose 9.9 percent
  • Traditional sales rose 10.0 percent; foreclosure sales fell 25.0 percent; short sales fell 31.1 percent
  • Previously-owned sales rose 5.7 percent; new construction sales rose 14.9 percent

Poignant Quotables

“The most important achievement of 2016 was erasing the losses in prices and equity caused by the downturn. As sales surpassed their 10-year high, Twin Citizens demonstrated that they are just as committed to homeownership as ever. There are some manageable challenges, but a favorable affordability picture, attractive rates, job growth and wage growth will continue to sustain a healthy real estate market,” said Cotty Lowry, President of the Minneapolis Area Association of REALTORS®.

“We reached some key milestones last year, and hope to continue with this momentum in 2017. It is a great time for those considering listing their home, as buyers are looking for more options. With median sales price at an all-time high, now is a great time to find out the current value of your home,” said Tina Angell, President of the St. Paul Area Association of REALTORS®.
From The Skinny Blog.

Eager buyers, tepid sellers and an imminent December rate hike

By Erin Milburn on Wednesday, December 14th, 2016

As Twin Citizens hunker down for winter, home buyers haven’t requested any time off this holiday season. Pending home sales rose 9.0 percent compared to last November and are at their highest level for any November since 2004. Closed sales likely reflect a sense of haste, as buyers closed on a whopping 25.2 percent more homes this November than last year. That represents the largest year-over-year increase in closed sales since February 2012, when closings increased 28.2 percent. Partly due to our lovely November weather, buyer activity this year fell much less from October to November than in past years.

Sellers were decidedly less optimistic about moving. Only 3,743 for-sale properties were listed on the market last month, 1.1 percent fewer than last November. Although home prices have reached their seasonal peak for the year, the median sales price increased 5.8 percent from last year to $232,000—uncharacteristically surpassing the $230,000 median price during September and October of 2016. Inventory levels dropped 22.8 percent to 10,706 active properties, which is nearing a 14-year record low. Additional listings are needed to address the current supply shortage—especially at the entry-level and first-time buyer price brackets.

Competing bids on attractive listings are common in low inventory environments, and homes tend to sell quickly for close to list price. Days on market until sale fell 16.4 percent to 61 days compared to 64 for the year so far. The average percent of original list price received at sale was 96.7 percent, 0.8 percent higher than last year. But the median percent of current list price received is 99.4 percent. Months supply of inventory fell 27.6 percent to 2.1 months—the lowest figure on record for any month since 2003. This indicator measures the balance between supply and demand in the marketplace. Generally, five to six months of supply is considered a balanced market.

“Strong buyer demand is still driving this market in a great big way,” said Judy Shields, Minneapolis Area Association of REALTORS® (MAAR) President. “While it’s not unheard of for pending sales to surpass new listings in a winter month, it is relatively uncommon.”

Nov2016_PR_Image-702x493While single family sales dominate the Twin Cities market by number, townhome sales showed the largest year-over-year sales increase followed by condos. Similarly, though previously-owned properties make up the largest share of sales, newly constructed properties had three times the year-over-year increase. The most active price range over the last 12 months is $190,000 to $250,000 but the largest gain in sales occurred in the $350,000 to $500,000 range.

A healthy Twin Cities labor market has been conducive to housing recovery. The most recent national unemployment rate is 4.6 percent, though it’s 3.1 percent locally. The Minneapolis–St. Paul metropolitan area has the fourth lowest unemployment rate of any major metro area.

The average 30-year fixed mortgage rate has risen to 4.13 percent, still well below a long-term average of about 8.0 percent. Marginally higher rates were widely expected in 2016, but the Federal Reserve hasn’t moved rates since last December. While “Fedspeak” is notoriously ambiguous, Chair Yellen recently gave markets an unusual amount of clarity regarding Fed policy. Expect a quarter or half point increase in the federal funds rate at their December meeting.

“Buyers are feeling the pressure to some degree but still remain sensible,” said Cotty Lowry, MAAR President-Elect. “Despite some interest rate risk and policy uncertainties moving forward, overall 2017 is expected to be another good year for housing.”
From The Skinny Blog.

Strong Demand, Rising Prices, but Weak Supply Heading into Winter

By Erin Milburn on Monday, November 14th, 2016

Pending home sales rose 1.6 percent compared to last year and reached their highest level for any October since 2004. Sellers listed 5,249 for-sale properties on the market, 9.5 percent fewer than last October. Closed sales increased 0.8 percent to 4,791. That closed sales figure is between 2004 and 2005 levels. Although home prices have reached their seasonal peak for 2016, the median sales price increased 6.5 percent from last year to $230,000. Buyers are still frustrated by a lack of options. Inventory levels fell 19.0 percent to 12,625 active properties. Additional listings are needed to ease the current supply shortage—especially at the entry-level and first-time buyer price points.

Multiple bids on attractive listings are common in low inventory environments, and homes tend to sell quickly. Days on market until sale fell 14.3 percent to 60 days. The average percent of original list price received at sale was 96.9 percent, 0.8 percent higher than last year. But the median percent of current list price received is 99.6 percent, the highest level since 2005. Months supply of inventory fell 24.2 percent to 2.5 months—the lowest October figure on record since the beginning of 2003. This indicator measures the balance between supply and demand in the marketplace. Generally, five to six months of supply is considered a balanced market. Less than that indicates a seller’s market.

NewListings-PR_2016-10

“Demand is still soaring while listing activity has weakened,” said Judy Shields, Minneapolis Area Association of REALTORS® (MAAR) President. “Partly because of that, we expect prices to remain firm through the winter months barring any unforeseen events.”

The strongest sales activity over the last 12 months is in the $190,000 to $250,000 range, followed by the $250,000 to $350,000 range. Although single family sales dominate the Twin Cities market by number, condo and townhome sales witnessed the largest year-over-year sales increase. Similarly, while previously-owned properties make up the largest share of sales, newly constructed properties had a stronger year-over-year gain.

A healthy Twin Cities labor market has been conducive to housing recovery. The most recent national unemployment rate is 4.9 percent, though it’s a healthier 3.3 percent locally. The Minneapolis-St. Paul-Bloomington metropolitan area has the fourth lowest unemployment rate of any major metro area.

Locally, the 30-year fixed mortgage rate stands at 3.55 percent compared to a long-term average of about 8.0 percent. Rates are still near their lowest levels in three years. Marginally higher rates were widely expected in 2016, but the Federal Reserve hasn’t moved rates since last December. Even though the Fed was widely expected to raise rates this December, market volatility could change that.

“Buyers are still very much motivated by the current environment, it’s weak seller activity that is holding this market back,” said Cotty Lowry, MAAR President-Elect. “As this recovery moves into its sixth year, it’s critical to remember that markets and economies are never ‘due’ for a decline the way the Cubs were ‘due’ for a World Series win. There is usually a reason.”
From The Skinny Blog.

Median Seller Tenure in Home (1985-2016)

By David Arbit on Monday, November 7th, 2016

Median-Seller-Tenure

For quite some time, NAR’s reports have shown that homeowners tend to stay in their homes for 5-7 years. Based on the data from NAR’s most recent Profile of Home Buyers and Sellers report, that was true up until 2008. By 2011–just after the seismic shifts that rocked the market–owner tenure rose to 9 years and has been range-bound between 8-10 years since 2010. The current 2016 median tenure stands at 10 years. In summary, owning a home used to be a 5-7 year proposition, but owners now tend to be staying in their homes between 8-10 years.

The fact that sellers are staying in their homes longer since the downturn is partly responsible for our low inventory levels. That said, this is still a median, meaning that half of homeowners spend less than 10 years in their home. At first, a relatively large share of homeowners were underwater and thus couldn’t sell (not the case anymore). But then rising prices, historically low rates and an improving economy caused buyer demand to surge far more quickly than listing activity. That has created a situation where sellers are confident about getting strong offers on their homes quickly, but they’re hesitant about being a buyer in this competitive and under-supplied marketplace. Many are making the decision to stay and possibly remodel their current space rather than competing and possibly making full price offers or better on the most desirable homes.

Don’t expect quick resolution on the inventory shortage. New construction activity isn’t helping to alleviate the shortage because it’s not profitable to build at the entry-level or first-time buyer price point. We’re optimistic about things loosening up a tad come Spring 2017, but it will take time for the market to rebalance and regain its footing.

Although this recovery has sent sales and prices more or less back to peak levels, the hunt for equilibrium continues.
From The Skinny Blog.

Prices Firm And Signs Of Seller Confidence Moving Into Fall

By Erin Milburn on Friday, October 14th, 2016

Seller activity increased 5.6 percent since last September, the largest increase all year. Sellers introduced 6,727 new listings to the marketplace. Closed sales increased 5.7 percent while pending purchase activity was flat. That closed sales figure is on par with 2005 levels. Although home prices have reached their seasonal peak for 2016, the median sales price increased 3.6 percent from last September. The midpoint where half the homes sold for more and half the homes sold for less was to $230,000. As has been the case for some time, buyers are greeted with a shrinking number of options. Inventory levels fell 16.1 percent to 13,918 active properties. Inventory constraints haven’t slowed down buyers yet, but additional listings are needed to ease the shortage—especially at entry-level price points.

Multiple bids on attractive listings are common in low inventory environments, and homes tend to sell quickly. Days on market until sale fell 13.8 percent to 56 days. That’s only two days away from the record in 2007. The average percent of original list price received at sale was 97.5 percent, 0.9 percent higher than last year and the highest figure for any September since 2005. Months supply of inventory fell 20.0 percent to 2.8 months—the lowest September figure on record since the beginning of 2003. This indicator measures the balance between supply and demand in the marketplace. Generally, five to six months of supply is considered a balanced market.

“This market doesn’t seem to be slowing down one bit,” said Judy Shields, Minneapolis Area Association of REALTORS® (MAAR) President. “Even though buyers are active, the market can still feel uneven in some ways. Homes in the $200,000 to $300,000 range are seeing the strongest interest.”

PendingSales_2016-09-702x212Indeed, the strongest sales activity over the last 12 months is in the $190,000 to $250,000 range, followed by the $250,000 to $350,000 range. Although single family sales dominate the Twin Cities market by number, condo and townhome sales witnessed the largest year-over-year sales increase. Similarly, although previously-owned properties make up the largest share of sales, newly constructed properties had a stronger year-over-year gain.

A strong Twin Cities labor market has also helped promote housing recovery. The most recent national unemployment rate is 5.0 percent, though it’s a healthier 3.6 percent locally. The Minneapolis-St. Paul-Bloomington metropolitan area has among the lowest unemployment rate of any major metro area.

Locally, the 30-year fixed mortgage rate stands at 3.49 percent compared to a long-term average of about 8.0 percent. Rates are now at their lowest level in three years. Marginally higher rates were widely expected in 2016, but the Federal Reserve hasn’t moved rates since last December. Barring any economic or political surprises, the Fed will likely raise rates this December.

“Despite some low inventory challenges, this market is on solid footing. In some ways, we’re in a classic chicken or egg dilemma,” said Cotty Lowry, MAAR President-Elect. “Which comes first? More listing activity or more inventory? Today’s sellers are skittish because it’s tough to find their next place. To break this cycle, sellers will need to list in higher numbers and move up the housing chain.”

All information is according to the Minneapolis Area Association of REALTORS® (MAAR) based on data from NorthstarMLS. MAAR is the leading regional advocate and provider of information services and research on the real estate industry for brokers, real estate professionals and the public. MAAR serves the Twin Cities 13-county metro area and western Wisconsin.
From The Skinny Blog.

Twin Cities Homes Selling in Record Time, But Key Differences Persist

By Aubray Erhardt on Friday, August 12th, 2016

Seller activity declined 5.5 percent since last July, as sellers introduced 7,522 new listings to the marketplace. Sales activity was slightly below year-ago levels. Closed sales fell 5.8 percent while pending sales—the number of signed purchase agreements—fell 3.1 percent. Buyers signed 5,560 new contracts and closed on 6,030 homes. That closed sales figure is on par with July 2003 levels. The July median sales price retreated slightly since June 2016, but increased 6.6 percent from July 2015 to $239,900. Mostly due to inventory constraints, prospective sellers are concerned about their ability to secure their next property in the current environment. Buyers saw little supply side relief, as inventory levels fell 18.1 percent to 14,457 active properties. The well-known inventory shortages haven’t slowed down buyers much, given June 2016 closed sales at a 12-year high.

historical-702x204

Low inventory, however, has helped draw out stronger offers. The average percent of original list price received at sale was 98.4 percent, the highest figure for any July since 2005. Low levels of for-sale housing also means the homes on the market tend to sell quickly. Cumulative days on market until sale fell 15.9 percent to 53 days. That’s the fastest market time for any month since the beginning of 2007. Months supply of inventory fell 23.7 percent to 2.9 months—the lowest July figure on record going back to the beginning of 2003. Generally, five to six months of supply is considered a balanced market.

MAAR-July-2016-Stats-News-Release-702x174

Our days on market indicator tells us that most homes are selling pretty quickly,” said Judy Shields, Minneapolis Area Association of REALTORS® (MAAR) President. “But that market-wide figure leaves out important differences between various communities, property types and price points. For example, the July market-wide average was 53 days but homes priced above $1 million are spending 174 days on the market.”

Over the last 12 months, properties in the $190,000 to $250,000 range have tended to sell the quickest, at an average of 54 days. As the price point rises, so does the amount of time spent on the market. There is a sweet spot whereby both lower and higher priced homes take longer to sell.

It’s also worth noting that the average market time figure can be skewed by properties that linger on the market. The median days on market was actually 25 for July, reflecting the mid-point where half the homes spent longer than 25 days on the market and half spent less.

“Those selling properties above the $500,000 mark know that patience is a virtue even in our current environment,” said Cotty Lowry, MAAR President-Elect. “The supply-demand balance in that segment is less competitive than the entry-level price points, plus consumers are limiting how much house they buy.”

From The Skinny Blog.

Ten Years Later To The Month: Twin Cities Home Prices Eclipse 2006 Record

By Aubray Erhardt on Tuesday, July 19th, 2016

The June 2016 median sales price for residential properties has reached a new all-time high, eclipsing the previous June 2006 record of $238,000. This measure of home prices rose 5.3 percent from June 2015 to $242,000. Seller activity rose 0.5 percent since last June to 8,727 new listings. Sales activity was roughly even with last year. Closed sales increased a modest 0.2 percent while pending sales—the number of signed purchase agreements—fell 0.7 percent. Buyers signed 6,175 new contracts and closed on 7,094 homes. That’s the highest volume of closed sales for any month going back to June 2004, a 12-year high. Mostly due to inventory constraints, prospective sellers are concerned about their ability to secure their next property in the current environment. June offered little supply-side relief, as inventory levels fell 18.2 percent to 14,214 active properties. Despite the attempt, consistent inventory shortages haven’t slowed down buyers much, given closed sales at a 12-year high.

Low inventory has helped draw out stronger offers. The average percent of original list price received at sale was 98.7 percent in June, the highest figure for any month since May 2005. Low levels of for-sale housing also means the homes on the market tend to sell quickly. Cumulative days on market until sale fell 16.7 percent to 55 days. That’s the fastest market time for any month since the beginning of 2007. Months supply of inventory fell 23.7 percent to 2.9 months—the lowest June figure on record going back to the beginning of 2003. Generally, five to six months of supply is considered a balanced market. While the metro as a whole is favoring sellers, not all areas, segments or price points necessarily reflect that. Market conditions are encouraging some sellers but not enough to fuel the demand seen in recent months.

July-MSP-Image-702x490“Prices returning to 2006 levels is nothing to fear,” said Judy Shields, Minneapolis Area Association of REALTORS® (MAAR) President. “This market is grounded in good fundamentals: supply and demand, smarter lending standards, job and wage growth, population growth, healthier household finances and rising rents. In the lead-up to 2006, home prices were driven by irrational exuberance and lax lending standards.”

A healthy Twin Cities labor market has also been conducive to our housing recovery. The most recent national unemployment rate is 4.9 percent, though it’s 3.1 percent locally. The Minneapolis-St. Paul-Bloomington metropolitan area has the third lowest unemployment rate of any major metro area. The fact that lower-priced foreclosures and short sales comprise a shrinking share of sales activity also helps with the recovery. Traditional (non-lender-mediated) properties made up 95.0 percent of all closed sales—the highest level in almost 10 years.

For the time being, the risk of higher interest rates seems to have subsided after “Brexit” and in light of other global economic concerns. Locally, the 30-year fixed mortgage rate fell to 3.5 percent compared to a long-term average of about 8.0 percent. Rates are now at their lowest level in three years. Marginally higher rates were widely expected in 2016, but further rate hikes are unlikely for the duration of the year.

“It shouldn’t be all that surprising that we’re back to where we were ten years ago,” said Cotty Lowry, MAAR President-Elect. “The forces behind this recovery are far more sustainable than last time. Clearly the Twin Cities economy is booming, even though buyers are still eager for more listings.”
From The Skinny Blog.

Sellers Uninspired by Record May Sales Activity

By Aubray Erhardt on Tuesday, June 14th, 2016

Pending home purchase activity exceeded year-ago levels for the 18th consecutive month. Buyers signed 6,809 new purchase agreements, a 9.9 percent gain compared to May 2015. Closed sales, however, rose 5.3 percent to 6,167—the highest May closed sales figure on record. In large part due to low inventory, would-be sellers are concerned about their ability to secure their next property in the current competitive environment. Inventory levels fell 20.6 percent to 13,372 active properties. Because of record demand, weak supply and a more expensive mix of homes selling, the May median sales price rose 5.7 percent to $236,826—second only to June 2006 for the highest monthly median sales price on record.

2016-05_image-702x516

Since the median percent of current list price received at sale was 100.0 percent, sellers effectively had the same chance of getting offers above their current list price as they did below. Those odds were exactly fifty-fifty—as they were in May 2005. That’s not the case for original list price, however. Cumulative days on market fell 21.1 percent to 60 days. That’s the fastest market time for any month since the beginning of 2007. Months supply of inventory fell 28.9 percent to 2.7 months—the lowest May figure on record going back to the beginning of 2003. Generally, five to six months of supply is considered a balanced market. While the metro as a whole is favoring sellers, not all areas, segments or price points necessarily reflect that. Market conditions are encouraging some sellers but not enough to fuel the demand seen in recent months.

“By a margin of just 26 units, last month’s closed sales reached a new record for May,” said Judy Shields, Minneapolis Area Association of REALTORS® (MAAR) President. “Despite record demand, not every home sells the day it hits the market in multiple offers. Some areas are more susceptible than others. Sellers hoping for short market times should know price strategy is still one of the most important factors in marketing your home.”

Smarter lending practices, job and wage increases, population growth, the ongoing threat of higher interest rates and relentlessly rising rents have all contributed to strong sales activity. A competitive Twin Cities labor market has also contributed to our housing recovery. Traditional (non-lender-mediated) listings made up 93.3 percent of all closed sales—the highest level in almost 10 years.

The most recent national unemployment rate is 4.7 percent, though it’s 3.4 percent locally. The Minneapolis-St. Paul-Bloomington metropolitan area has the fourth lowest unemployment rate of any major metro area. The 30-year fixed mortgage rate continued to hover around 3.6 percent compared to a long-term average of approximately 8.0 percent. Rates took a surprising dive after the Federal Reserve announced the first hike last year. Marginally higher interest rates were widely expected in 2016, though futures contracts currently peg the odds of a June rate hike at 4.0 percent and a July rate hike at 36.0 percent.

“Interest rates and job growth are fueling the demand in our market,” said Cotty Lowry, MAAR President-Elect. “But we have a serious inventory shortage that we know is holding back buyers, meaning there is still pent-up demand that may not have existed in a more balanced market.”
From The Skinny Blog.